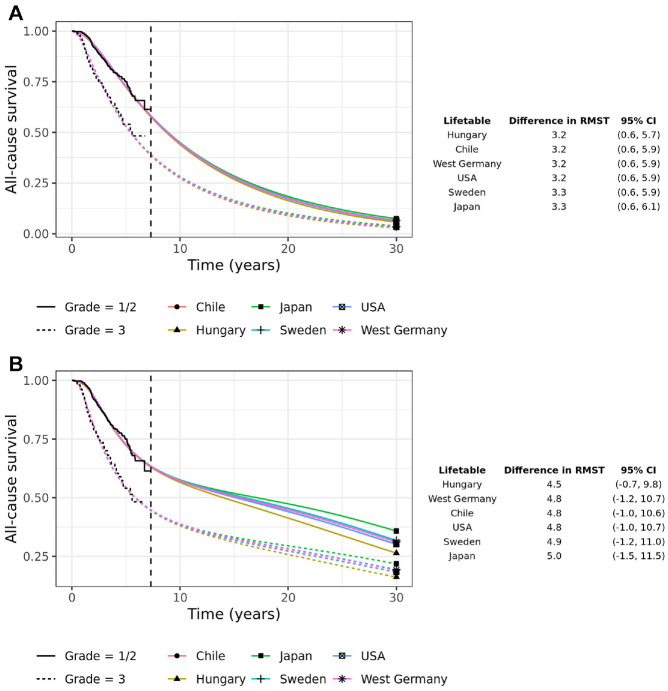
Figure 5.
All-cause survival extrapolation of the stratified Log-normal excess hazard models with and without cure, where background mortality rates used for model fitting are taken from 1 of 6 countries and predictions are made for the country used in the estimation. The table shows the difference in 30-y restricted mean survival time (RMST) with 95% confidence intervals. (a) Scenario 1: Excess hazard model without cure (same lifetable for estimation and prediction), (b) Scenario 1: Excess hazard model with cure (same lifetable for estimation and prediction).

