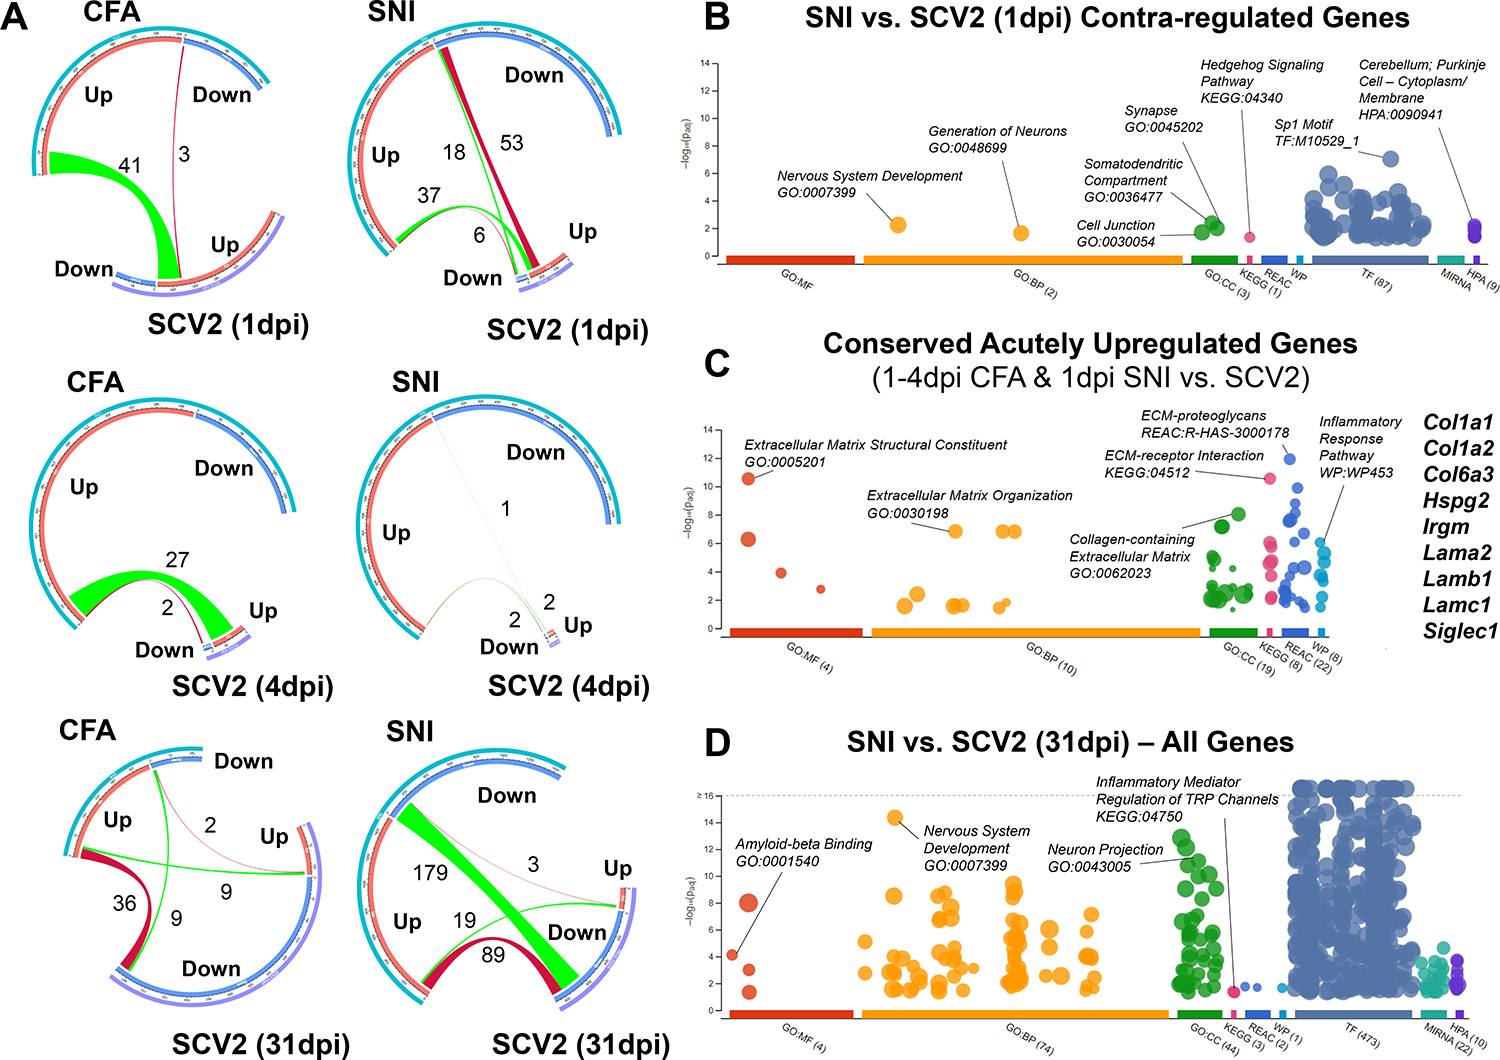
Figure 6. SARS-CoV-2 infection causes a longitudinally variable tDRG transcriptomic profile that shares pro-nociceptive components yet demonstrates unique plasticity signatures.

(A) Chord diagrams of gene expression changes in the tDRG assessing links between those regulated in mice by CFA or SNI with those regulated in hamsters by SARS-CoV-2 infection 1, 4, and 31 dpi. CFA and SNI, N = 3 female mice per group; SARS-CoV-2 1 and 4 dpi, N = 4 male hamsters per group; SARS-CoV-2 31 dpi, N = 3 male hamsters per group. (B-D) Dot plots presenting the identification of statistically significant (-log10 P-adj. > 1.3) gene ontologies (GO), pathways (KEGG, Kyoto Encyclopedia of Genes and Genomes; REAC, Reactome; WP, WikiPathways), transcription factors (TF, Transfac), microRNAs (MIRNA, miRTarBase), and tissue/cell expression profiles (HPA, Human Protein Atlas) associated with contra-regulated genes (B), conserved acutely upregulated genes (C), and among all genes (D) in the tDRG between the groups indicated, described in (A). Dot plots are adapted from g:Profiler. GO terms: MF, Molecular Function; BP, Biological Process; CC, Cellular Compartment.
