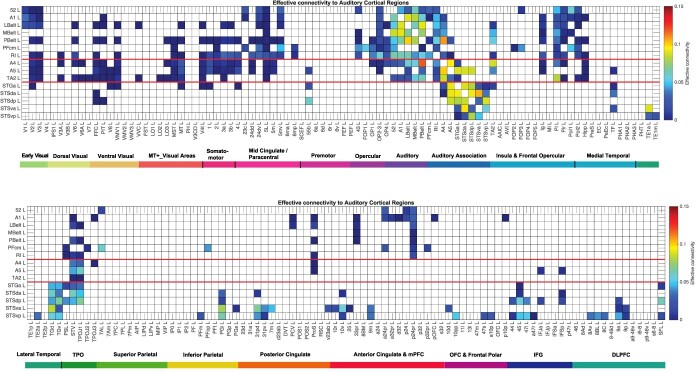
Fig. 2.
Effective connectivity TO auditory cortical regions (the rows) FROM 180 cortical areas (the columns) in the left hemisphere. The effective connectivity is read from column to row. Effective connectivities of 0 are shown as blank. All effective connectivity maps are scaled to show 0.15 as the maximum, as this is the highest effective connectivity found between this set of brain regions. The effective connectivity color scale has been set to have a maximum of 0.15 as that is the range for the auditory regions, with the maximum value of 0.2 set by the connectivity between V1L and V2L. The regions above the upper red line are in the HCP-MMP “early auditory” division; between the two red lines are in the “auditory association” division; and below the lower red line are for the cortex in and related to the superior temporal sulcus (STS). The effective connectivity for the first set of cortical regions is shown in the top panel; and for the second set of regions in the lower panel. Abbreviations: See Supplementary Table S1. The colored labeled bars show the cortical divisions in the HCP-MMP atlas (Glasser et al. 2016a). The order of the cortical regions is that in Huang, Rolls et al (2022).

