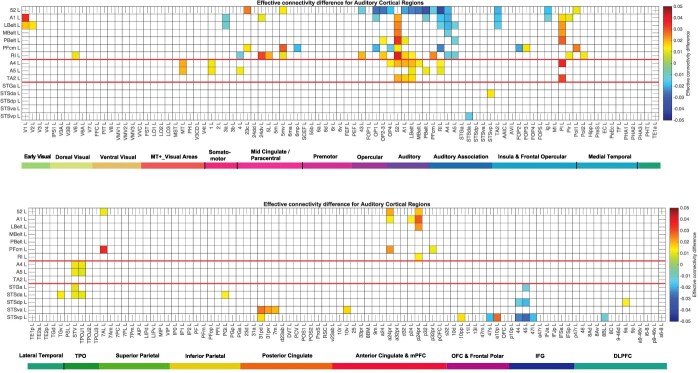
Fig. 4.
Difference of the effective connectivity for auditory cortical regions with other cortical regions. For a given link, if the effective connectivity difference is positive, the connectivity is stronger in the direction from column to row. For a given link, if the effective connectivity difference is negative, the connectivity is weaker in the direction from column to row. This is calculated from 171 participants in the HCP imaged at 7T. the threshold value for any effective connectivity difference to be shown is 0.01. The color scale shows effective connectivity differences in the range − 0.05 to +0.05. The abbreviations for the brain regions are shown in Supplementary Table S1, and the brain regions are shown in Fig. 1 and Supplementary Fig. S1. The effective connectivity difference for the first set of cortical regions is shown in the top panel; and for the second set of regions in the lower panel. Conventions as in Fig. 2.

