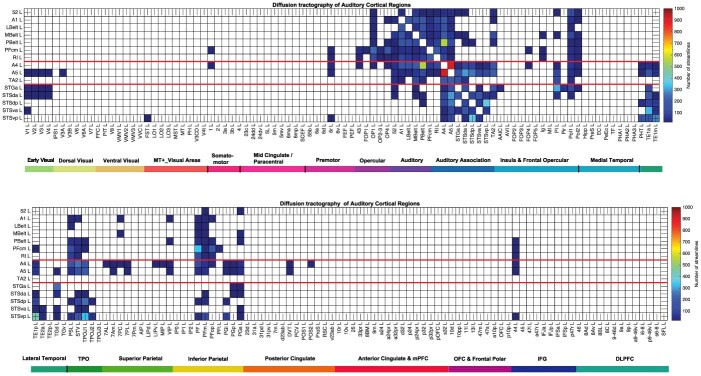
Fig. 6.
Connections between the auditory cortical regions and 180 other cortical regions in the left hemisphere as shown by diffusion tractography using the same layout as in Figs. 2 and 5. The number of streamlines shown was thresholded at 10 and values less than this are shown as blank. The color bar maximum was set to 1000 streamlines to show some detail for the lower values, and the maximum number of streamlines across the brain regions shown was 1100 (excluding a few outliers). Abbreviations: See Supplementary Table S1. Conventions as in Fig. 2.

