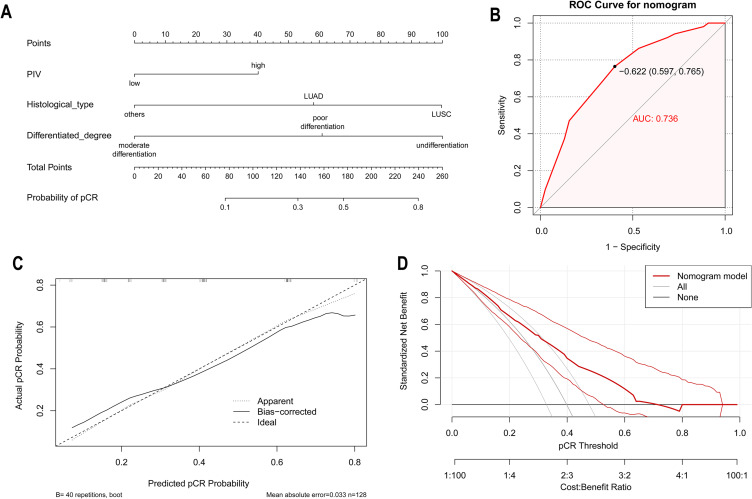
Figure 3.
Development and validation of the nomogram. (A) The nomogram for predicting pCR for NSCLC patients after neoadjuvant immunochemotherapy, according to which, each variable could be assigned a score on the point scale, by adding up the total score and locating it on the total point scale, we could draw a straight line down to determine the estimated probability of pCR; (B) the receiver operating characteristic curve for the nomogram; (C) the calibration plots for the nomogram. Predicted and actual pCR probability were respectively plotted on the X-axis and the Y-axis. The 45-degree dashed lines through the coordinate origin represent the excellent calibration models; (D) the decision curve analysis of the clinical value for the nomogram indicated that when the nomogram is used to predict the risk (probability) of pCR, patients could obtain better clinical benefits within wide range of risk (probability) threshold. The gray curve represents the hypothesis that all patients with NSCLC undergoing neoadjuvant immunochemotherapy. The black line represents the hypothesis that all NSCLC patients do not undergo neoadjuvant immunochemotherapy.

