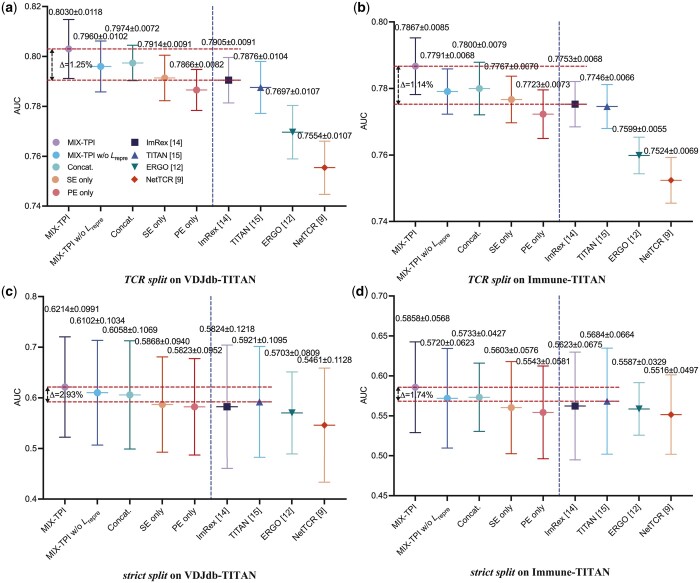
Figure 4.
The average AUC of the compared methods on the VDJdb-TITAN and Immune-TITAN datasets by different data splitting strategies. The left side of each subfigure represents the results of MIX-TPI’s variants, while the right side of each subfigure denotes the results of the compared state-of-the-art methods.

