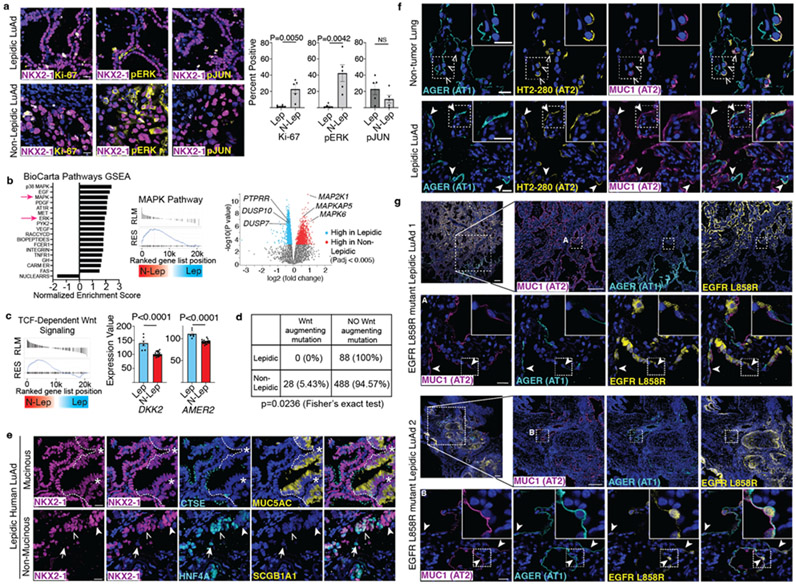
Figure 4: Human lepidic LuAds share histological and molecular features with mouse AT1 derived LuAds.
(a) Representative images of human lepidic (top) and non-lepidic (bottom) LuAd stained for proliferation (Ki-67), pERK and pc-JUN (n=5 individuals per group). (b) GSEA evaluating BioCarta pathways of cDNA microarray data from Zabeck et al. of lepidic and non-lepidic LuAds shows enrichment of MAPK and ERK activity in non-lepidic tumors (n=6 lepidic and 21 non-lepidic LuAds) (left). GSEA plot of the BioCarta MAPK pathway (center). Volcano plot of differentially expressed genes in the lepidic and non-lepidic groups highlighting members of the peptidyl-tyrosine dephosphorylation GO, PTPRR, DUSP10, and DUSP7, as well as constituents of MAPK signaling MAP2K1, MAPKAP5, MAPK6. (c) GSEA evaluating for canonical Wnt signaling revealed enrichment in the non-lepidic group (left) while several Wnt inhibitors, including DKK2 and AMER2, were more highly differentially expressed in the lepidic group (right). (d) A comprehensive mutation analysis by Caso et al. into lepidic and non-lepidic tumors reveals a lack of Wnt augmenting mutations in lepidic tumors with a significant number of Wnt augmenting mutations in non-lepidic human LuAd. (e) Human lepidic mucinous (top) and non-mucinous (bottom) LuAd both contain NKX2-1+ cells co-expressing intestinal markers (CTSE, HNF4A, left side of image at top and open arrowhead on bottom panel). The non-mucinous tumor also contains NKX2-1+HNF4A− (solid arrowhead) and NKX2-1−HNF4A+ (arrow) cells. Mucinous (MUC5AC+) region is NKX2-1Lo (asterisk). (e) Co-staining for AT1 (AGER) and AT2 (MUC1, HT2-280) membrane antibodies shows co-exclusive marking of AT1 and AT2 cells (open arrowheads) in non-tumor human lung (top) but co-expression of AT1 and AT2 markers by squamous cells in human lepidic LuAd (bottom, closed arrowheads). (f) Co-staining of AT1 (AGER), AT2 (MUC1) and driver mutation (EGFR L858R) antibodies in human lepidic LuAd showing ubiquitous oncogene and AT2 marker staining of the tumor but also flat cells in the periphery positive for the driver mutation that co-express both AT1 and AT2 markers (arrowheads) (n=2 individuals).
Scale bars, 20 μm (a, e, f, g rows 2 and 4) and 200 μm (g rows 1 and 3)
GO, gene ontology; GSEA, Gene Set Enrichment Analysis; Lep, lepidic; N-Lep, non-lepidic; NS, not significant; pERK, phosphorylated ERK; pJUN, phosphorylated c-JUN/JUND
Data in bar graphs of a and c are mean±s.e.m. P values calculated by Student’s t test except where indicated otherwise.

