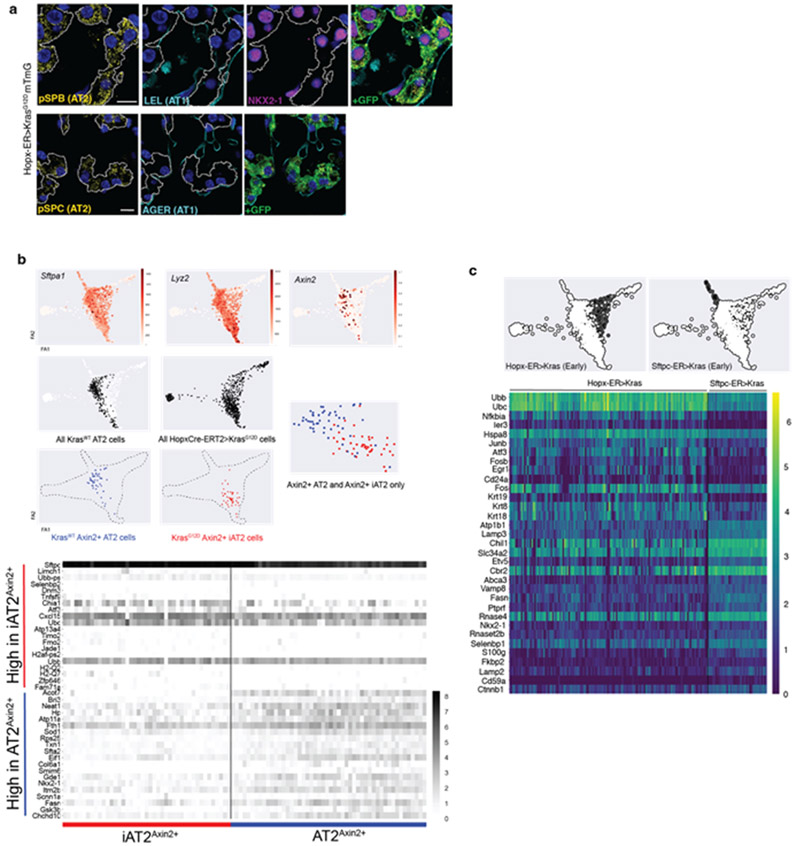
Extended Data Figure 2: Comparison of AT2 and iAT2 cells and their resulting tumors.
(a) Co-staining of early-stage AT1 adenomas shows absence of AT1 (LEL, AGER) and presence of AT2 (SFTPB, SFTPC) markers as well as cuboidal morphologies. (b) Feature plots localizing Axin2+ AT2 and iAT2 in single cell RNA sequencing data demonstrating co-clustering (above) with a heatmap of differentially expressed genes between the two groups (below). (c) Heatmap of the most differentially expressed genes between AT2>Kras cells 18d after Kras induction and early-stage AT1>Kras cells. Note on PAGA that the early-stage AT1 and AT2 tumor populations are distinct from normal AT2 and iAT2 (AT1>Kras) cells and that their trajectories diverge from each other.
Scale bars, 10 μm (a)
LEL, Lycopersicon esculentum lectin

