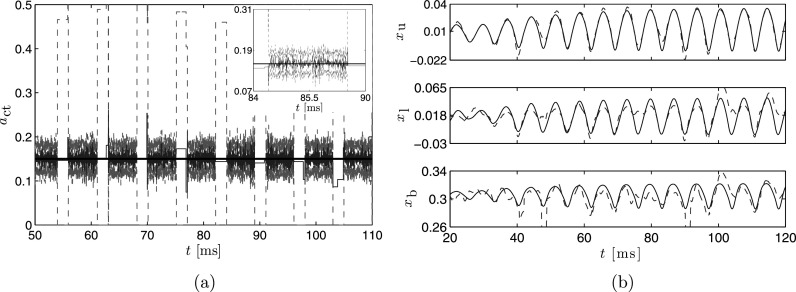
FIG. 3.
(Color online) (a) Time series of the MAP estimate computed using the particle filter (dashed line) and the associated credibility bounds for each time step (dotted line). The true value for is the horizontal solid line. Spikes in the credibility limits occur when the glottis is closed. The inset shows the behavior of the estimate between glottal closures. (b) Time series of the estimated (dashed line) and true (solid line) displacement of the upper, lower, and body masses.

