
FIG. 8.
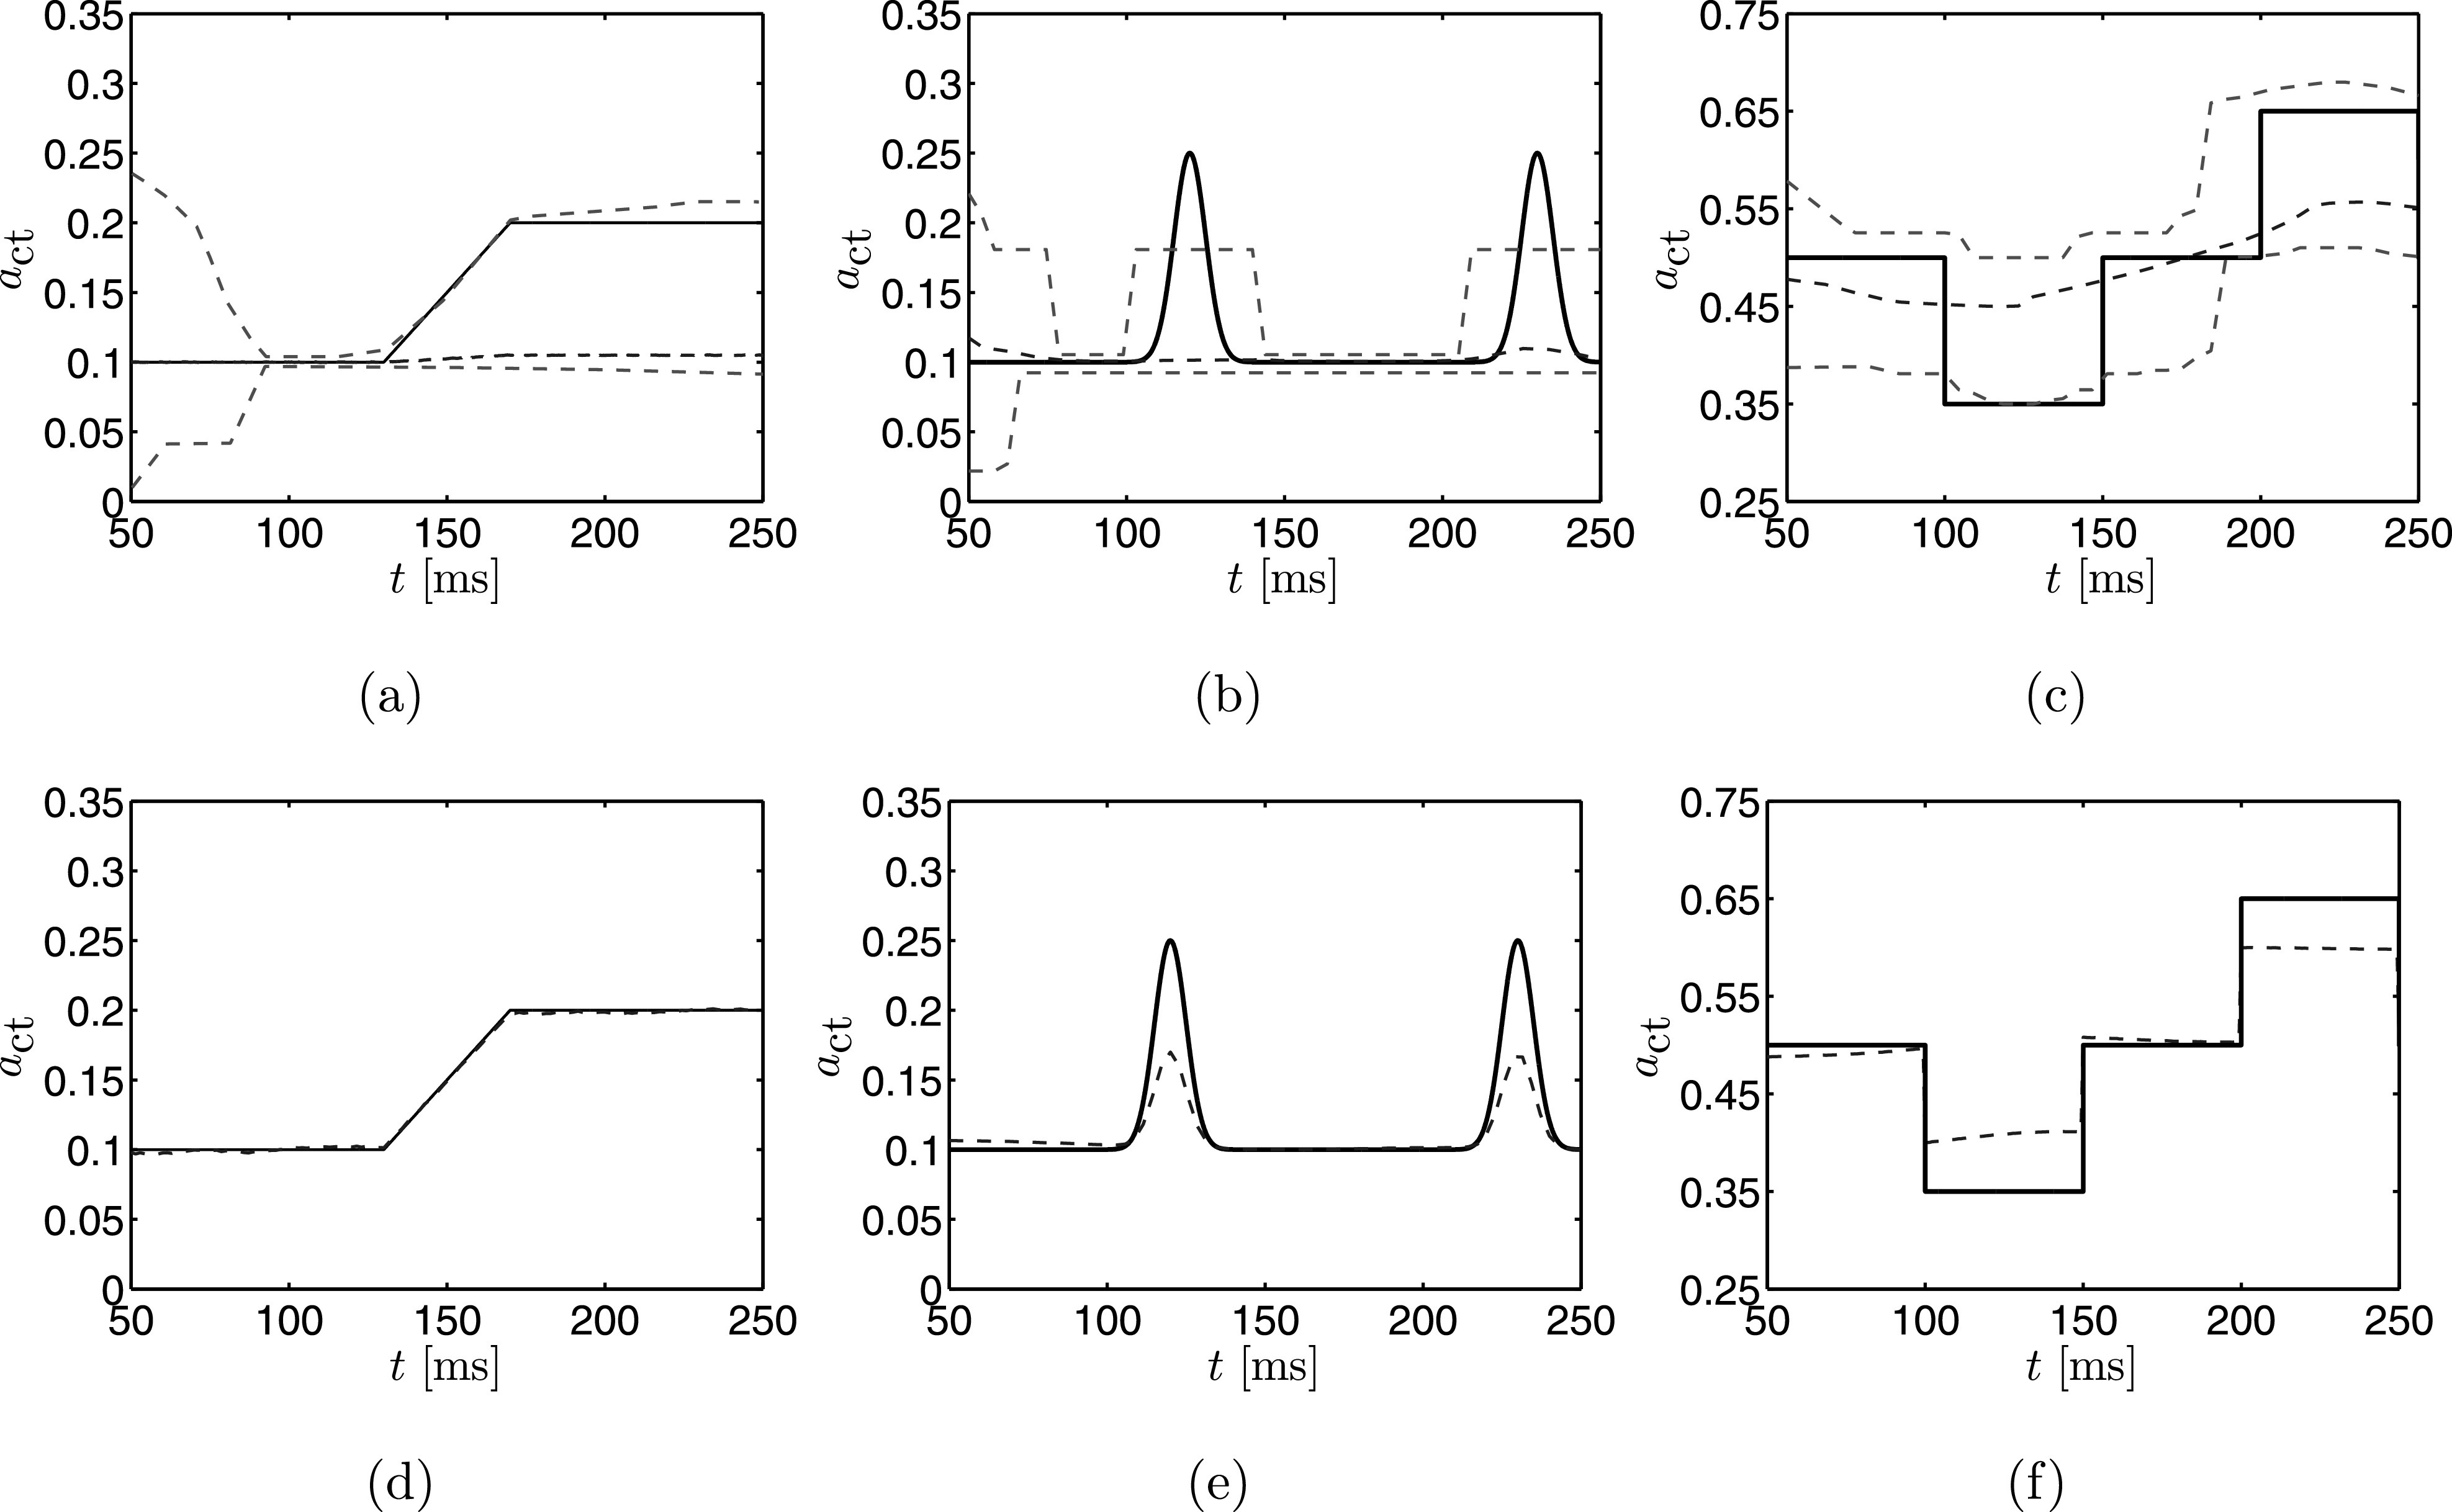
(Color online) (a)–(c) Estimates for the three test cases when the importance sampling method is used. (d)–(f) Estimates for the three cases when the Nelder-Mead method is used. The dashed lines are the time series of estimated by each respective technique, while the solid line corresponds to the true value. Bounding dashed lines in (a)–(c) are the credibility bounds.