
FIG. 9.
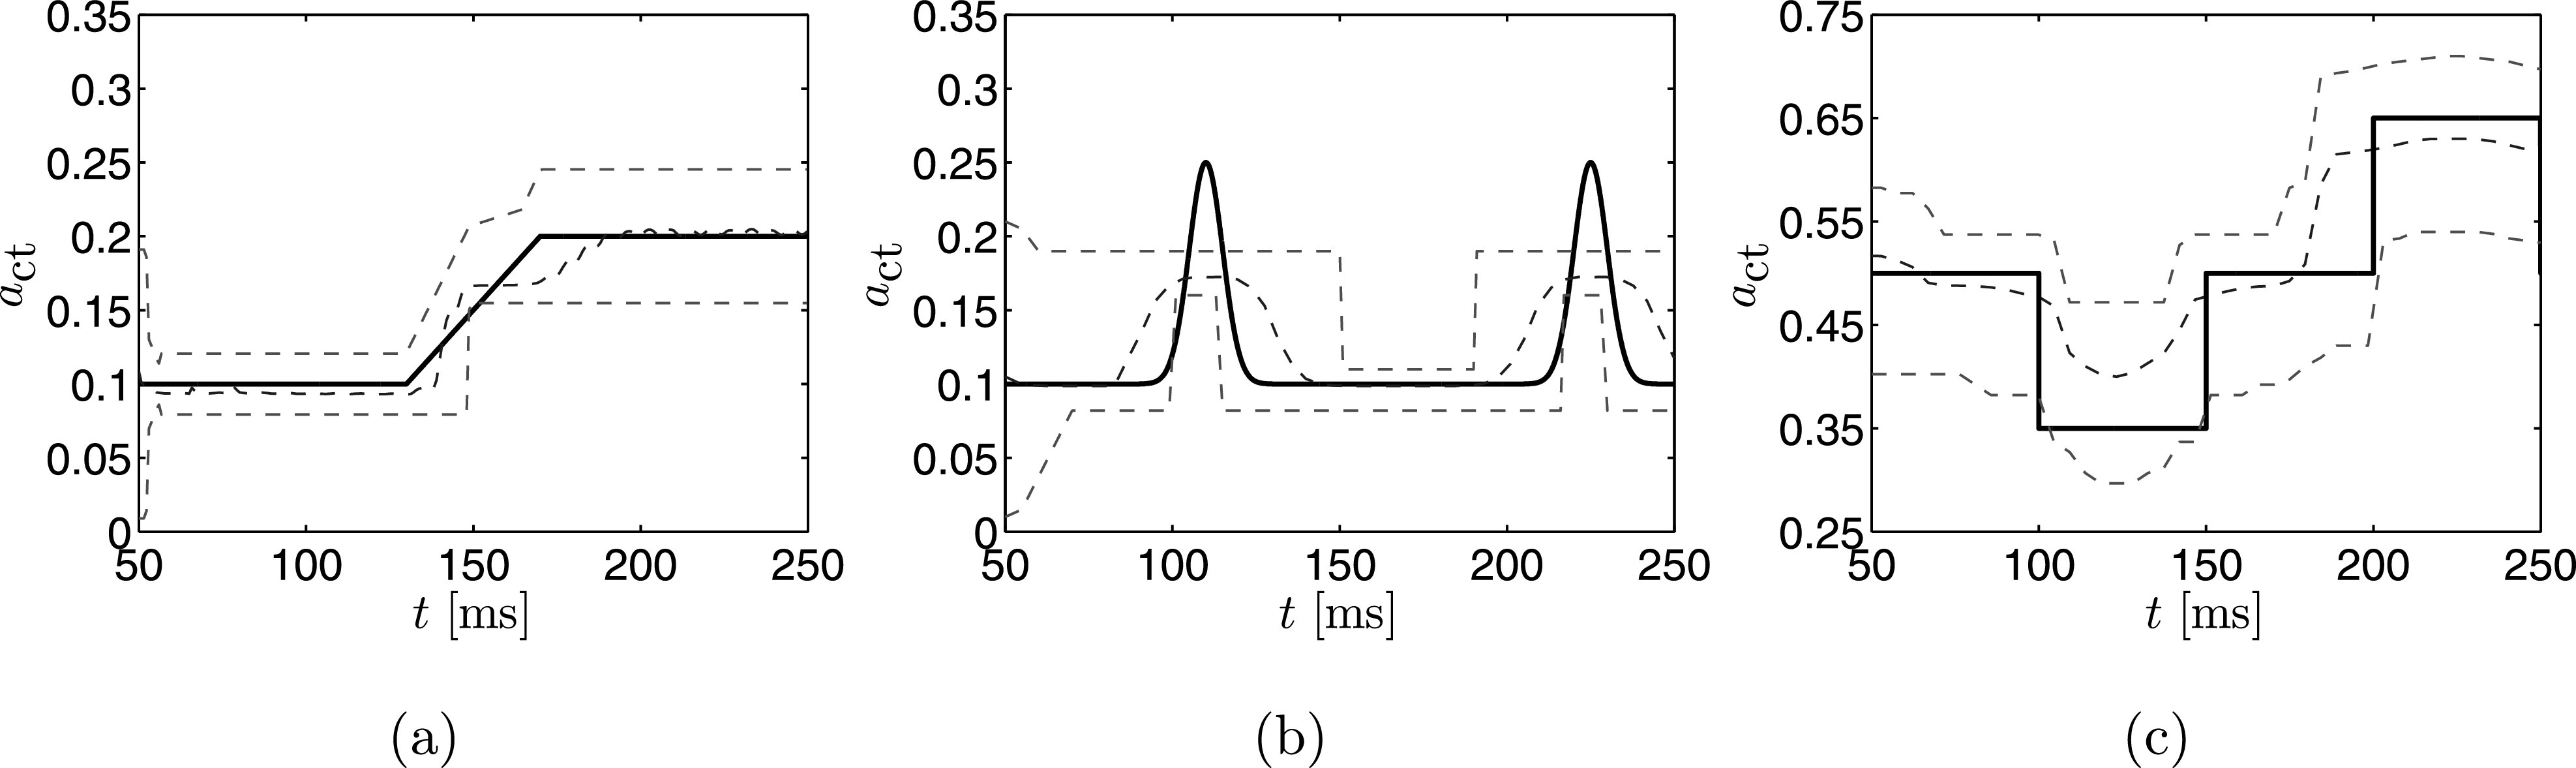
(Color online) The true time series (solid line) plotted with the MAP estimate (dashed line) and 95% credibility bounds (dashed line) computed using importance sampling when the fundamental frequency measure is computed using a moving time window for the three time varying simulations.