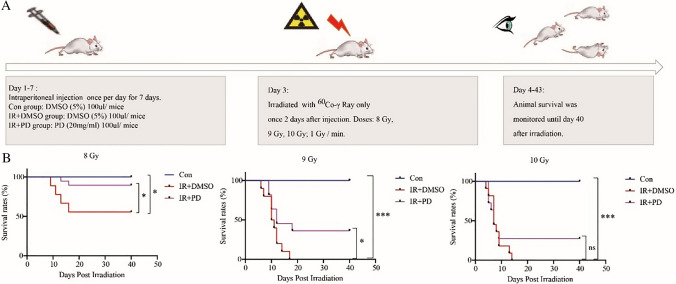
Fig. 2.
Survival curves of different treatment groups. a Design and flow chart of animal survival experiment using Balb/c mice. b Balb/c mice were randomly assigned into different groups (10 mice for each group including CON group, IR + DMSO group, and IR + PD group). Administration of DMSO (5%) or PD (2 mg/mice) was performed intraperitoneally 2 days before 60Co-γ radiation exposure (A: 8 Gy; B: 9 Gy; C: 10 Gy; dose rate: 1 Gy / min). Animal survival was monitored until day 40 after exposure. *p < 0.05, **p < 0.01, ***p < 0.001, ****p < 0.0001

