Fig. 6.
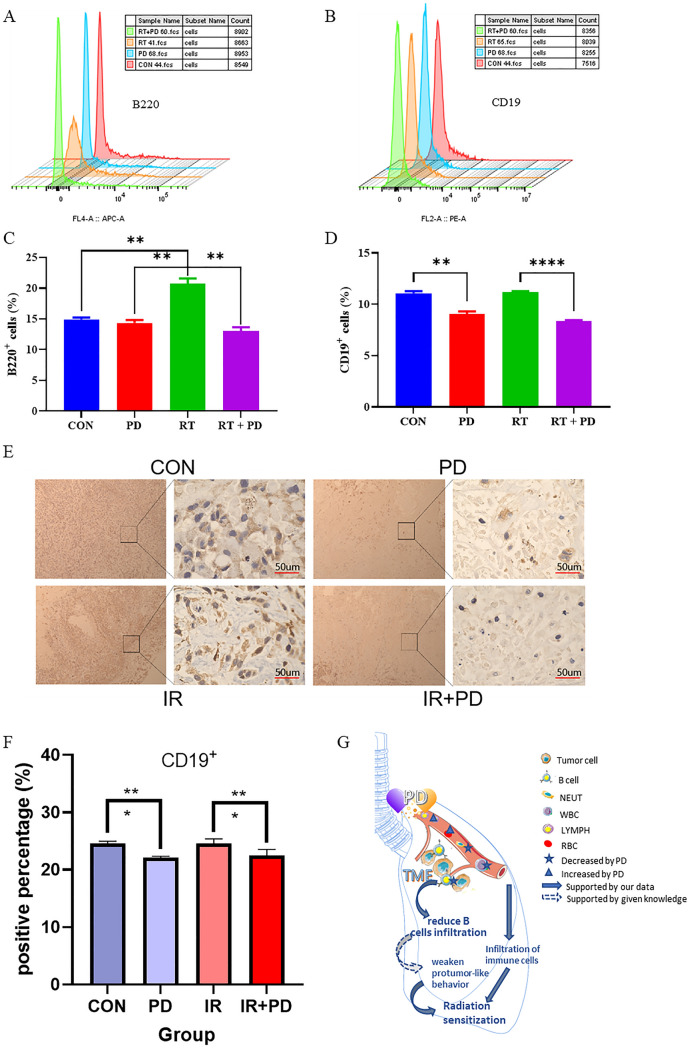
Tumor-associated B cells analysis in vivo. a, b Representative histograms of each representative treatment group in flow cytometry experiments. c, d Quantitative comparison of the B220- or CD19-positive rates between different treatment groups calculated from three independent flow cytometry tests. e, f Representative pictures and the quantitative statistical histogram for the CD19 IHC experiment for labeling B cells within the tumors. g Mechanism diagram for PD’s RMDF role in lung cancer radiotherapy. *p < 0.05, **p < 0.01, ****p < 0.0001

