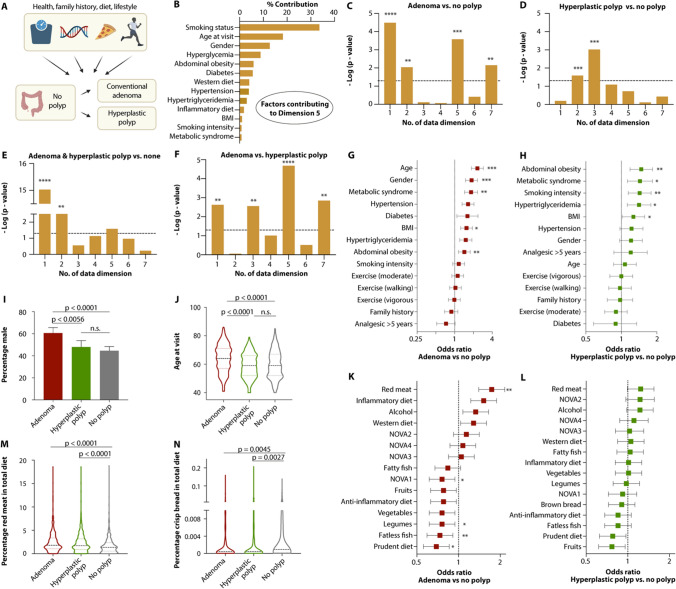
Fig. 2.
Pathway-specific risk factor characterization. A Schematic of computational analysis of risk factors influencing the development of adenomatous versus serrated precursor lesions. B Percent contribution of each risk factor to dimension 5 of the mixed factor model. C–F Results of unpaired t-test comparing the dimension coordinate of each dimension for individuals with conventional adenomas (C), hyperplastic polyps (D), both types of lesions (E), or between the two types of precursor lesions (F). G, K Odds ratio plots with Wald 95% confidence intervals for risk factors for the conventional (G) and alternative (H) precursor pathway. Asterisks indicate results of the significance of logistic regression models of each risk factor, adjusted for age, gender and BMI. I, J Comparison of male sex (I) and age (J) in cohorts with colonoscopy-based detection of adenomas, hyperplastic polyps, or neither. K, L Odds ratio plots with Wald 95% confidence intervals for conventional (K) and alternative (L) precursor pathway risk factors. Asterisks indicate results of the significance of logistic regression models of each risk factor, adjusted for age, gender and BMI. M, N Comparison of red meat consumption (M) and crisp bread consumption (N) in cohorts with colonoscopy-based detection of adenomas, hyperplastic polyps, or neither. Ordinary one-way ANOVA with Turkey’s multiple comparisons (C–F, I, J, M, N), Benjamini–Hochberg-adjusted p-values from logistic regression models (G, H, K, L). *p < 0.1, **p < 0.05, ***p < 0.001, ****p < 0.0001 was considered significant. Error bars (I) indicate mean with 95% confidence intervals

