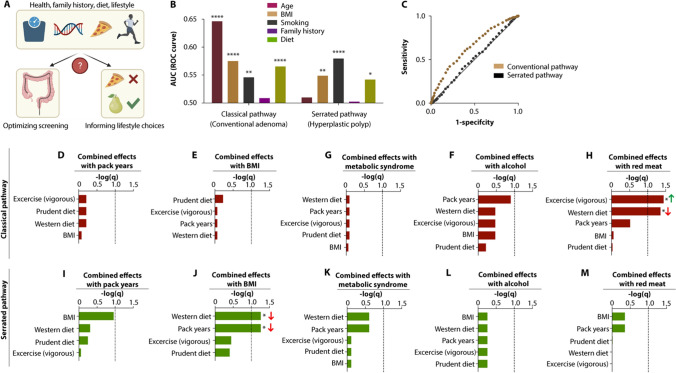
Fig. 4.
Combinatorial effects of risk factors on detection efficiency and polyp risk modulation. A Schematic of strategic approach to optimize screening strategies and lifestyle recommendations based on risk factor contributions. B ROC analysis of age, BMI, smoking, family history, and diet for colonoscopy findings in the classical and alternative pathways of precursor lesions. C ROC curve for age in the conventional and alternative pathway. D–M Results of likelihood ratio tests, showing significance of the combined effects of any two risk factors in the conventional (D–H) and serrated (I–M) pathways. Arrows indicate recommendations for risk mitigation (red arrows: risk exacerbation, green arrows: risk mitigation). Benjamini–Hochberg-adjusted p values from likelihood ratio tests (D–M); dashed lines represent significance threshold. *p < 0.1, **p < 0.05, ***p < 0.001, ****p < 0.0001 was considered significant

