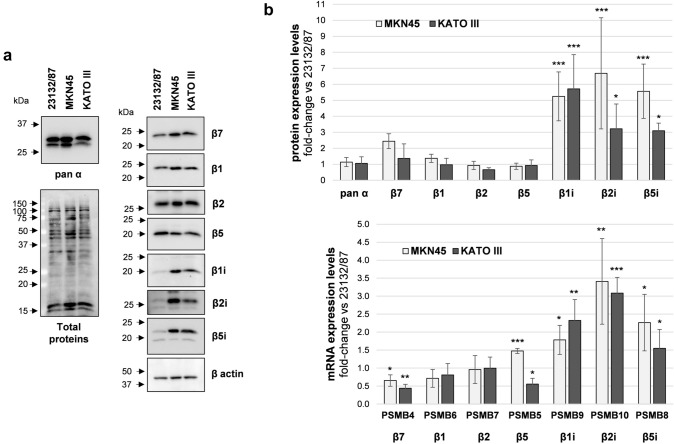
Fig. 1.
Proteasome and immunoproteasome subunit expression in GC cell lines. a Representative images of proteasome subunit levels in GC cells; total proteins and β-actin were stained as loading controls. Whole cell extracts were separated onto 12% (w/v) polyacrylamide gels (2.5 µg/lane). After SDS-PAGE, proteins were immunoblotted and stained with the indicated antibodies. Total proteins were visualized on the membrane with the No stain labeling reagent. Image acquisition was performed in a ChemiDoc system. On the left, arrows indicate the position of molecular weight markers b proteasome subunit protein and mRNA levels. Quantification of the immunoreactive bands and of whole protein content was performed with the Image Lab software. Both total proteins and β-actin were used as loading control since β-actin levels were not significantly different between the cell lines. mRNA levels were determined by Real-time PCR and normalized on β2-microglobulin. The normalized signal for each subunit was expressed as fold change relative to 23132/87 cells. Bars are the mean ± SD of the values obtained in at least three independent extracts for protein and mRNA level quantification, respectively, using different batches of cells. *p < 0.05; **p < 0.01, ***p < 0.001 vs α subunits for proteins and vs 23132/87 ΔCt values for mRNAs

