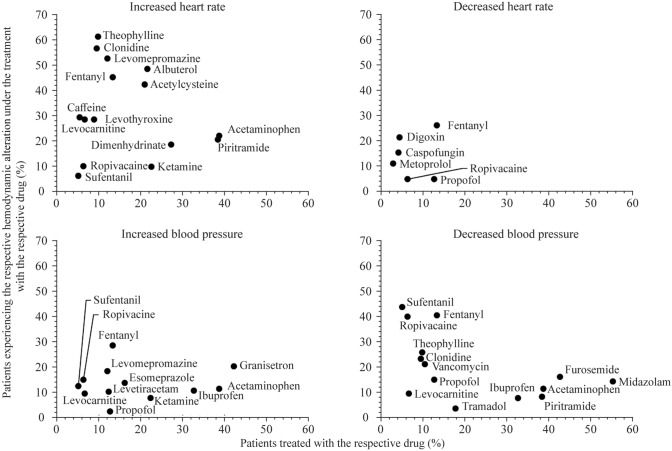
Fig. 2.
Specific drugs temporally associated with hemodynamic alterations. For each observed hemodynamic alteration, the number of patients who received a drug is plotted against the number of patients in whom the respective alteration occurred during therapy with the specific drug; only drugs whose reported frequency was classified as “common” according to the database search were considered; drugs administered in at least 5% of patients are shown.

