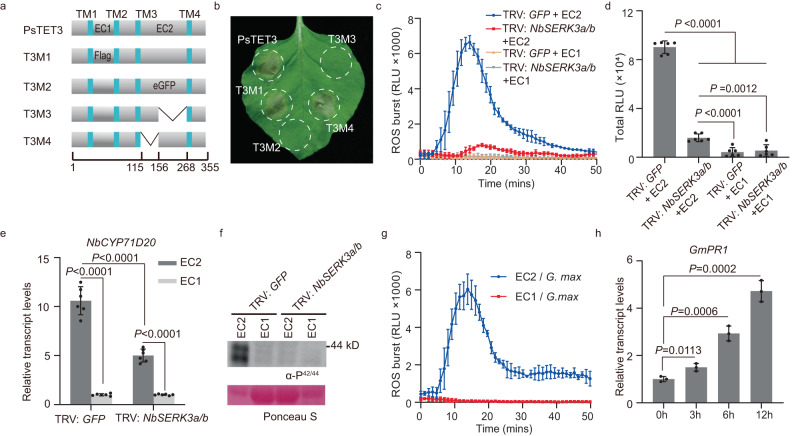
Fig. 4. EC2 is the key region for PsTET3 to induce immune responses.
a Schematic diagram showing the protein structures of PsTET3 and derived deletion or replacement mutants. PsTET3 and indicated mutants fused with eGFP at the N terminus. b Representative N. benthamiana leaves infiltrated with indicated constructs were photographed 3 days after infiltration. c, d Production of ROS in TRV: GFP or TRV: NbSERK3a/b N. benthamiana leaf discs treated with 1 μM EC2-His protein or control. Mean values (±SD) of six measurements are shown. Statistical analyses were performed using Two-tailed Student’s t test. e Relative transcript levels of PTI-marker gene NbCYP71D20 in TRV: GFP or TRV: NbSERK3a/b N. benthamiana leaves infiltrated with 1 μM purified EC2-His protein or control (EC1-eGFP-His). Levels of NbCYP71D20 were normalized to NbEF1α then set relative to the levels of the buffer control (which was set to 1). Mean values (±SD) of six measurements are shown. Statistical analyses were performed using Two-tailed Student’s t test. f MAPK phosphorylation triggered by 1 μM EC2-His in TRV: GFP or TRV: NbSERK3a/b N. benthamiana leaves. Ponceau S-stained Rubisco protein is shown as a total protein loading control. g Production of ROS in G. max leaf discs treated with 1 μM EC2-His protein or control. Mean values (±SD) of three replicates are shown. h Relative transcript levels of PR1 gene in G. max roots treated with 1 μM purified EC2-His protein or control (EC1-eGFP-His). Relative transcript levels were determined by RT-qPCR. Mean values (±SD) of three replicates are shown. Statistical analyses were performed using Two-tailed Student’s t test. All experiments were repeated three times with similar results. Source data are provided as a Source Data file.

