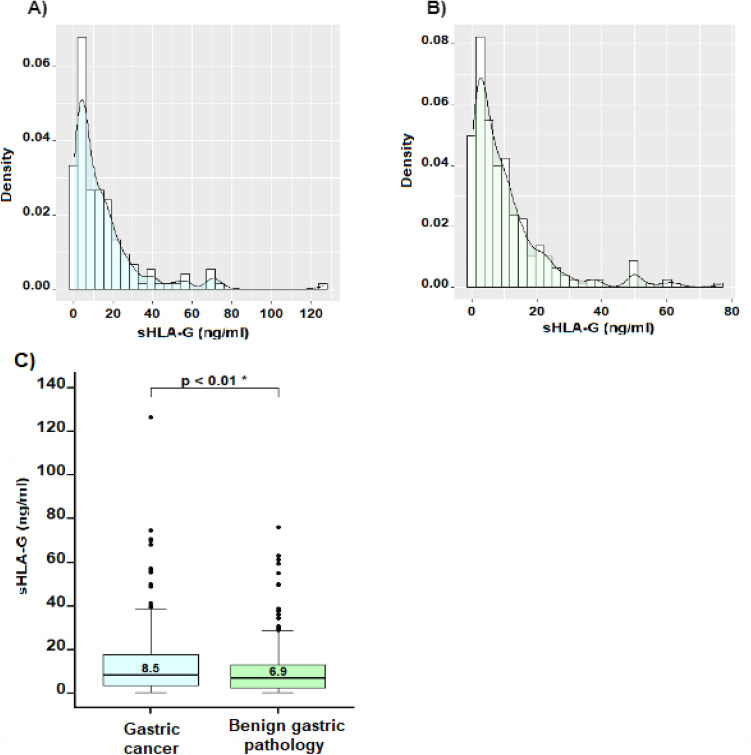
Figure 1.
Expression levels of HLA-G in patients with gastric cancer (n = 173) and benign gastric pathology (n = 307) are shown. (A) and (B) Density plots illustrate the asymmetric distribution of sHLA-G expression levels, indicating that most observations were concentrated between 0 and 30 ng/ml. (C) Comparison between the groups of patients with malignant and benign pathology revealed significantly higher levels in the gastric cancer group compared to the benign pathology group (p-value < 0.05).

