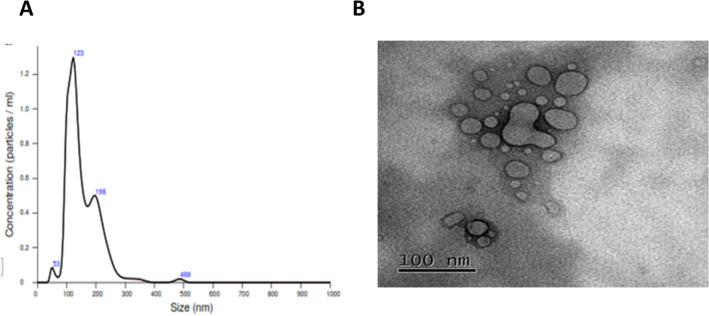
Figure 3.
Size of the exosomes isolated from fractions 6/7 to 14 obtained by molecular exclusion chromatography of the plasma of patients with GC (n = 25). (A) The nanoparticle tracking analysis (NTA) screenshot shows a range of particle sizes observed between 50 and 123 nm, which corresponds to the reported size range of exosomes. (B) The transmission electron microscopy (TEM) screenshot displays microvesicles isolated from the plasma of gastric cancer patients, with sizes ranging from 100 nm.

