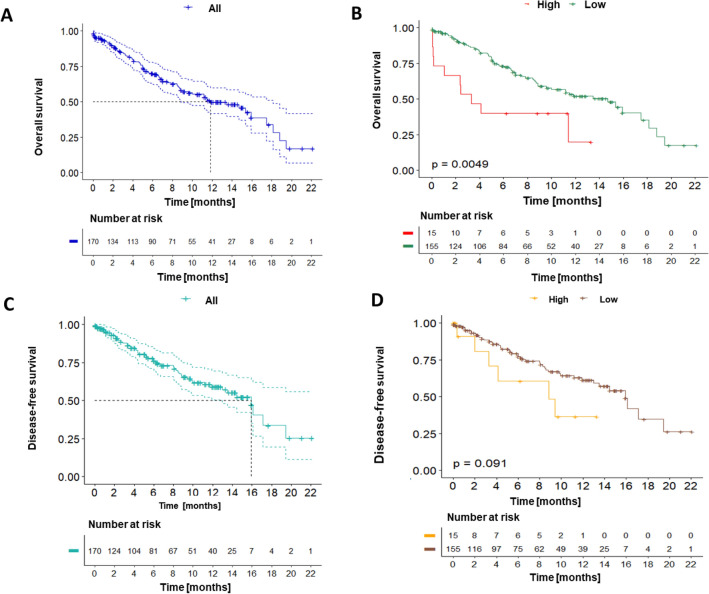
Figure 5.
Kaplan–Meier curves were generated to analyze overall survival (OS) (Fig. 5A,B), and disease-free survival (DFS) in the entire cohort of gastric cancer patients as well as stratified by sHLA-G expression levels (Fig. 5C,D). (A) The 12-month OS for the entire cohort was 49.9% with a median survival of 11.8 months. (B) Patients with high sHLA-G expression had a significantly lower 12-month OS compared to those with low expression. (C) The 12-month DFS for the entire cohort was 59.2% with a median survival of 15.9 months. (D) Patients with High HLA-G expression had a lower 12-month DFS those with low expression group (p-value > 0.05)., hierarchical cluster analysis using Ward's method of minimum variance was performed to determine that the cut-off point for sHLA-G levels was 39.95.

