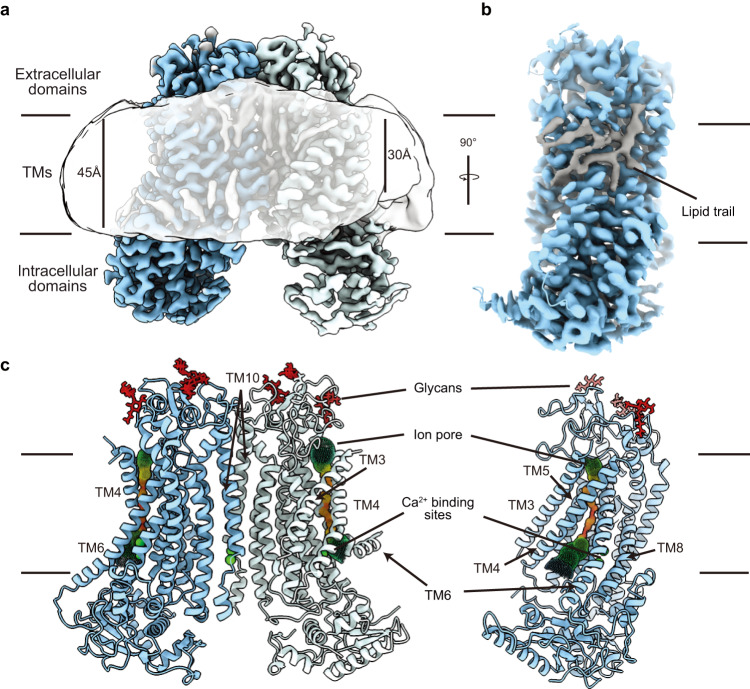
Fig. 2. Cryo-EM analysis reveals asymmetry of the TMEM16F dimer.
a Cryo-EM density of the asymmetric state of the TMEM16F dimer with the monomers colored blue and light blue, respectively, and the lipid densities in grey. The gaussian filtered cryo-EM density (semitransparent) reveals distortion of the lipid nanodisc. b Side view of a TMEM16F monomer (blue) highlighting the trail of lipids (grey) covering the TM region. c Front and side view of the atomic model of the asymmetric state of TMEM16F with Ca2+ atoms and glycans shown in green and red, respectively. The ion conduction channel identified by HOLE is represented by spheres colored in rainbow scale based on the local width of the channel, where red <1.5 Å and blue >7.5 Å.

