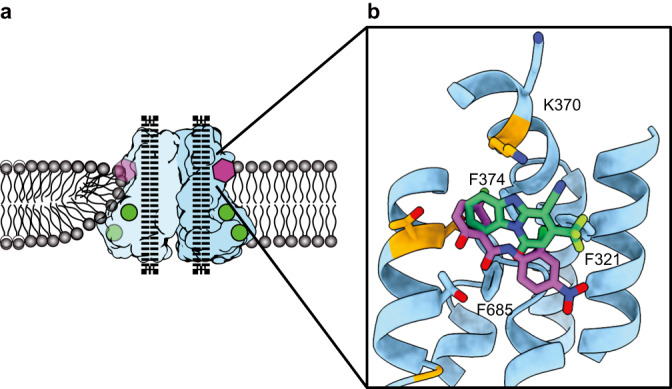
Fig. 6. The drug binding pocket identified in TMEM16F.

a Schematic representation of the TMEM16F dimer (light blue and blue) embedded in a lipid bilayer (grey), where Ca2+ atoms are shown as green circles and the inhibitors as a purple polygon and dotted black lines represent the closed ion conduction pore. b Structure of the drug binding pocket in TMEM16F with the side chains of the surrounding residues shown as sticks and the non-conserved residues highlighted in orange. Computationally docked structures of niclosamide and 1PBC are shown in purple and green, respectively. All atoms are colored by heteroatom.
