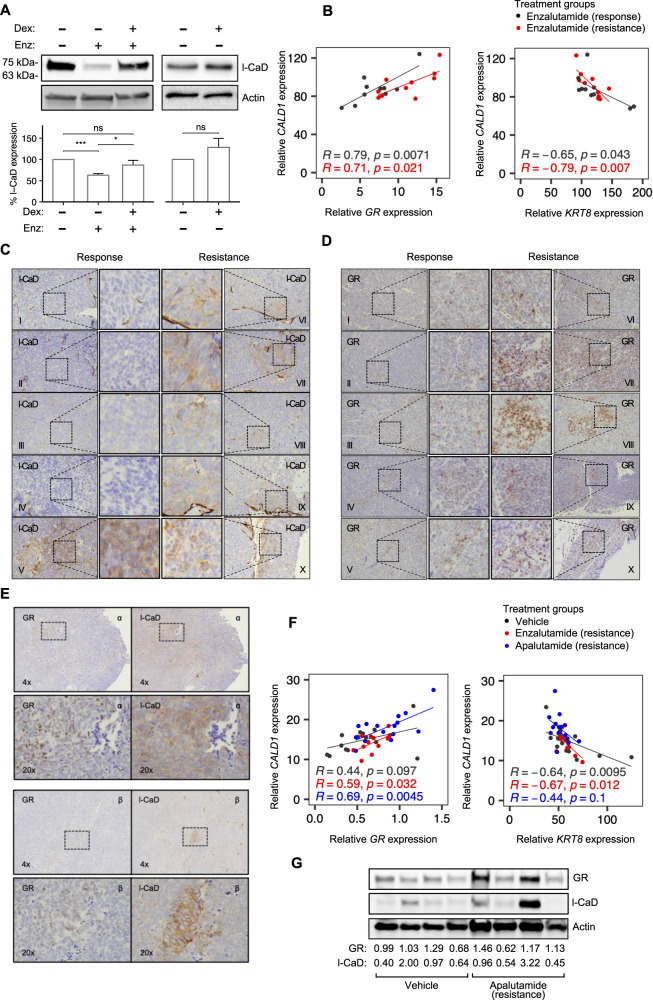
Fig. 5. l-CaD expression is upregulated during enzalutamide resistance in vivo.
A Representative Western blot depicting l-CaD expression and barplot depicting pooled densitometry of Western blot bands from three biological repeats after treatment with enzalutamide (5 days, 10 µM) and Dex (24 h, 0.1 µM). B Scatterplots depicting Pearson correlation between CALD1 and GR or KRT8 mRNA from enzalutamide-treated VCaP xenograft mice. C IHC of l-CaD in castration-resistant VCaP xenografts during enzalutamide response (left) and after attained enzalutamide resistance (right). Individual mice are denoted using Roman numerals. D IHC of GR in castration-resistant VCaP xenografts during enzalutamide response (left) and after attained enzalutamide resistance (right). Individual mice are denoted using Roman numerals. E IHC of l-CaD and GR from adjacent slices of VCaP xenograft tumors in mice during apalutamide resistance. The lower row shows a higher magnification image of the area highlighted on the upper row. Individual mice are denoted using Greek letters. F Scatterplots depicting Pearson correlation between CALD1 and GR or KRT8 mRNA from vehicle-, enzalutamide-, and apalutamide-treated VCaP xenograft mice. G Western blot of vehicle- and apalutamide-treated castration-resistant VCaP xenografts. Quantification of the GR and l-CaD signal relative to actin loading control signal and the average vehicle-treated signal is shown below.

