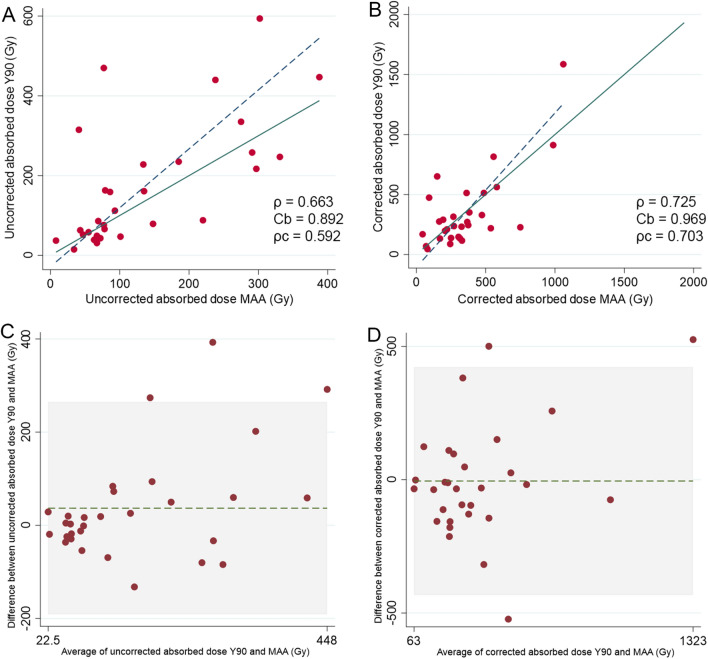
Figure 1.
Comparison of absorbed tumor dose between 90Y-predictive dosimetry by 99mTc-MAA-SPECT/CT and post-SIRT dosimetry on 90Y-PET/CT. Plots illustrating Lin’s concordance correlation coefficient between predicted and effective tumor doses in uncorrected (A) and corrected (B) doses. Dark blue dashed lines represent linear regression fitted with least-squares method and green lines represent perfect concordance. Bland–Altman plot comparing agreement of dose measurements between 90Y-predictive dosimetry by 99mTc-MAA-SPECT/CT and post-SIRT dosimetry without (C) and with dose correction (D).

