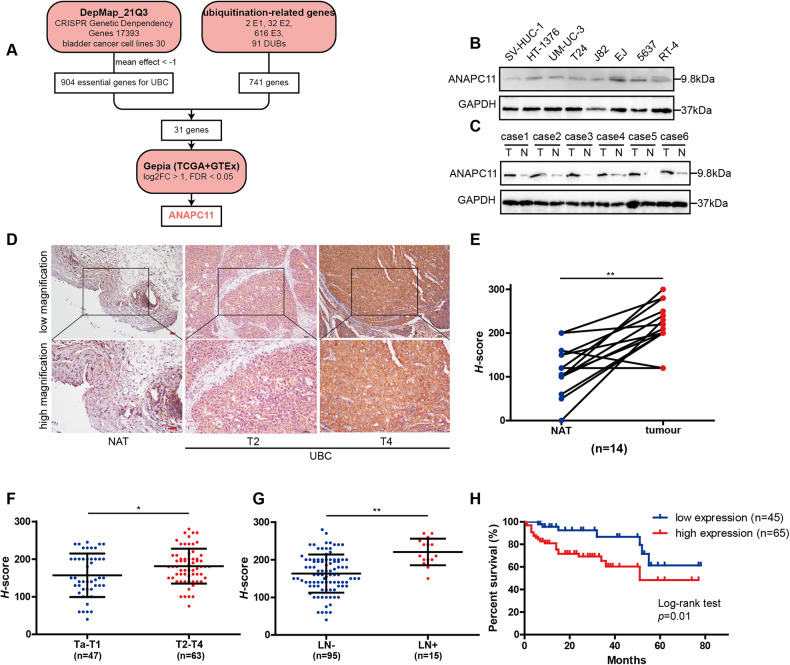
Fig. 1. ANAPC11 overexpression is associated with poor prognosis in UBC.
A Flow diagram showed a brief illustration of how ANAPC11 was screened out. B Western blot analysis of the expression of ANAPC11 in immortalized uroepithelial cell line (SV-HUC-1) and seven UBC cell lines (HT-1376, UM-UC-3, T24, J82, E-J, 5637, and RT-4). C Western blot analysis of ANAPC11 expression in six UBC patient specimens. T for tumor and N for NAT. D Representative images of ANAPC11 expression in the NAT and UBC with different T stages, evaluated by IHC staining. E H-scores of 14 paired UBC and NAT specimens. Paired, two-tailed, Mann-Whitney U test. F, G H-scores of 110 UBC patients’ tissues compared by T stage and LN status. Mann–Whitney U test. H The Kaplan–Meier survival curve is comparing 110 patients’ survival with relatively low or high expression of ANAPC11. Log-rank test. Data are shown as mean ± SD. *P < 0.05, **P < 0.01. Scale bar = 100 μm.

