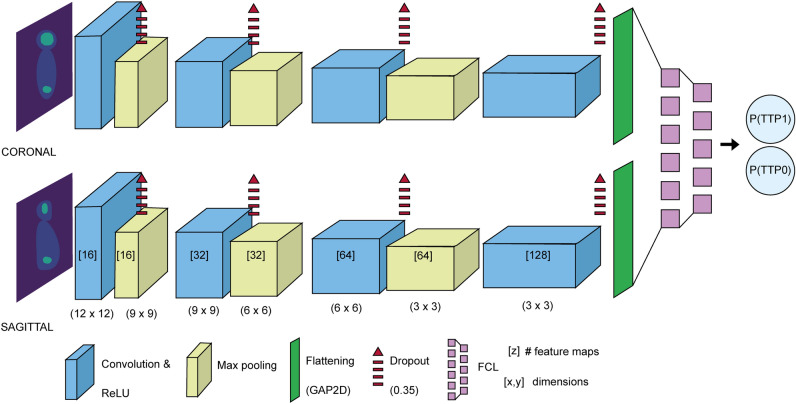
Figure 3.
CNN architecture. In the convolution layers, the number of feature maps is shown, followed by the size of these matrices. The max pooling layers are depicted with the feature detector dimensions. A spatial dropout and the ReLU activation function were applied to each convolution layer. The model was compiled using the Adam optimizer, with LRt = 0.00005 and DR = 0.000001. Coronal and sagittal outputs are concatenated in the dense layer or fully connected layer (FCL).

