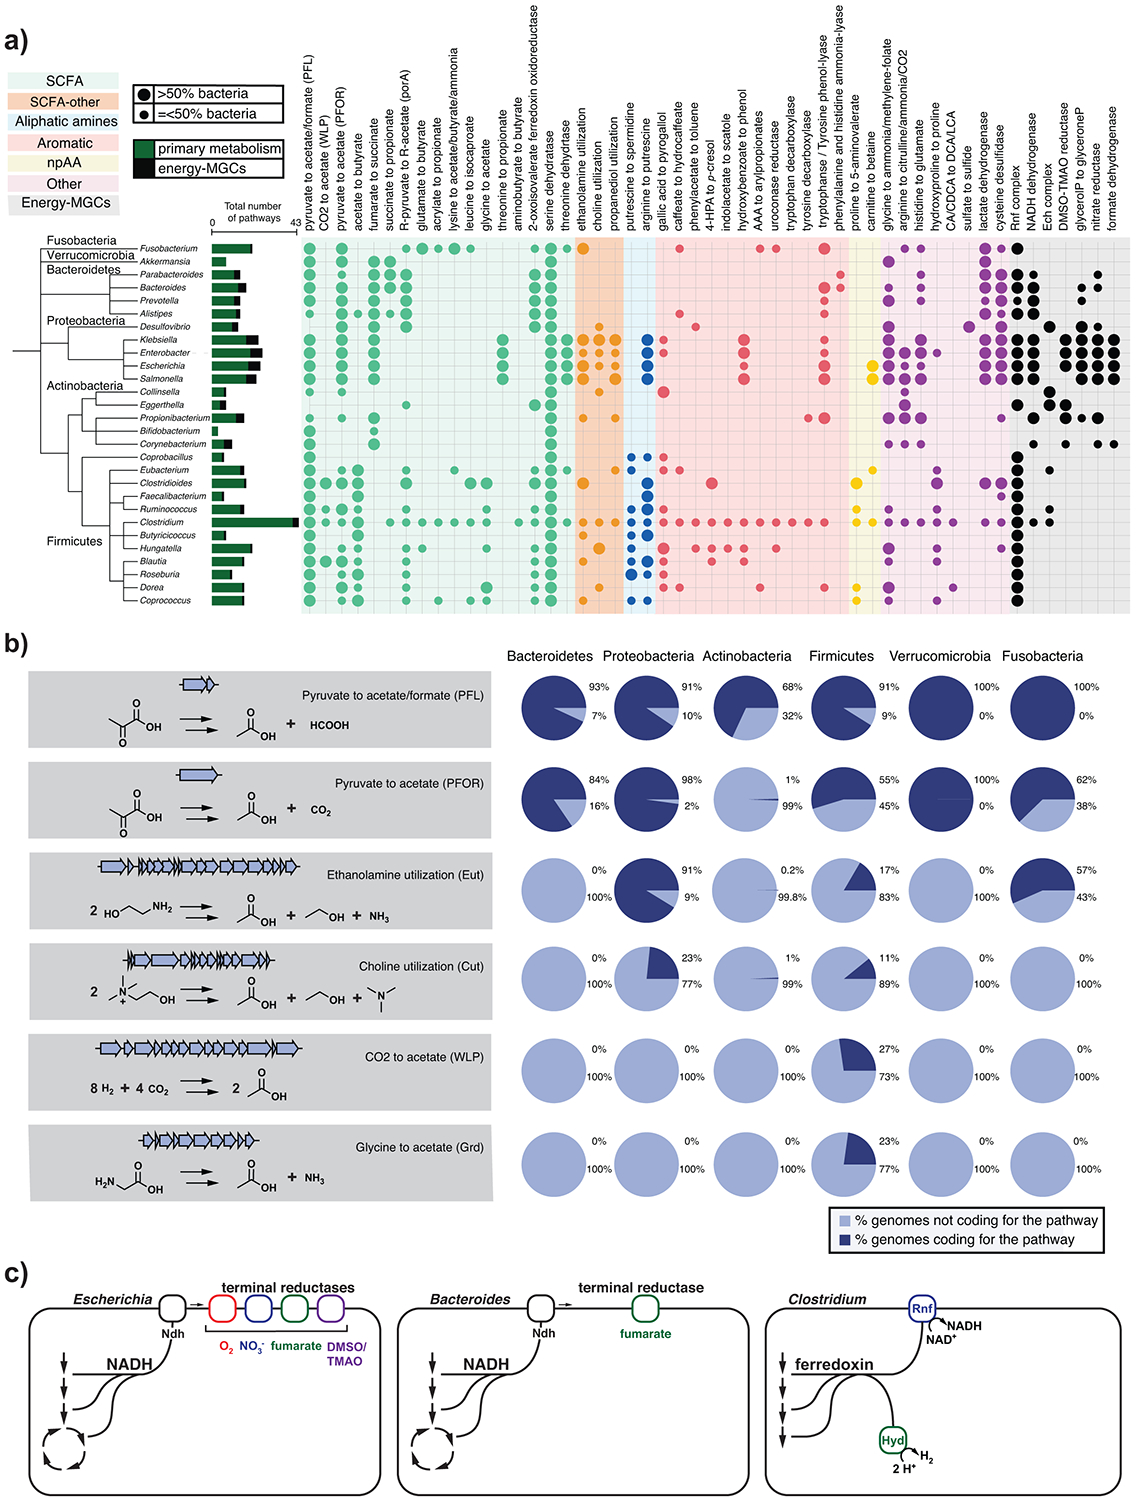
Figure 2: Distribution of known pathways across most representative genera in the human gut.

(a) Circles represent the absence/presence of known pathways in each genus. Larger circles indicate cases in which more than 50% of the genomes for a genus encode the pathway, while smaller circles indicate cases in which 50% or fewer of the genomes encode it. Colored ranges indicate a categorization of MGCs by chemical class of their product, in which npAA represents nonproteinogenic amino acids and SCFA represents short-chain fatty acids. Taxonomic assignments were applied using the Genome Taxonomy Database release 95 (GTDB)14. The tree was generated using phyloT (https://phylot.biobyte.de/) and visualized using iTOL15. Raw data are available in Table S5. (b) Distribution of the main acetate synthesis pathways at phylum level. Some of the pathways are ubiquitous across the five major phyla (e.g. pyruvate to acetate/formate [PFL]), while others are only found in Firmicutes (CO2 to acetate [WLP]). Raw data for the pie charts is available in Table S6. Genes and gene clusters depicted are representatives from Bacteroides thetaiotaomicron (PFL & PFOR), Salmonella enterica (Eut), Clostridium sporogenes (Cut), Clostridium difficile (WLP) and Clostridium sticklandii (Grd). (c) Bioenergetic strategies in Escherichia that has a variety of alternate electron acceptors to choose from compared to Bacteroides and Clostridium. Abbreviations: PFL, pyruvate formate-lyase; PFOR, pyruvate:ferredoxin oxidoreductase; Eut, ethanolamine utilization; Cut, choline utilization; WLP, Wood-Ljungdahl Pathway; Grd, glycine reductase; CA, cholic acid; CDCA, chenodeoxycholic acid; DCA, deoxycholic acid; LCA, lithocholic acid; TMAO, trimethylamine N-oxide; DMSO, dimethylsulfoxide; SCFA, short-chain fatty acid; Ndh, NADH dehydrogenase, Rnf, Rhodobacter nitrogen fixation like complex; Hyd, hydrogenase.
