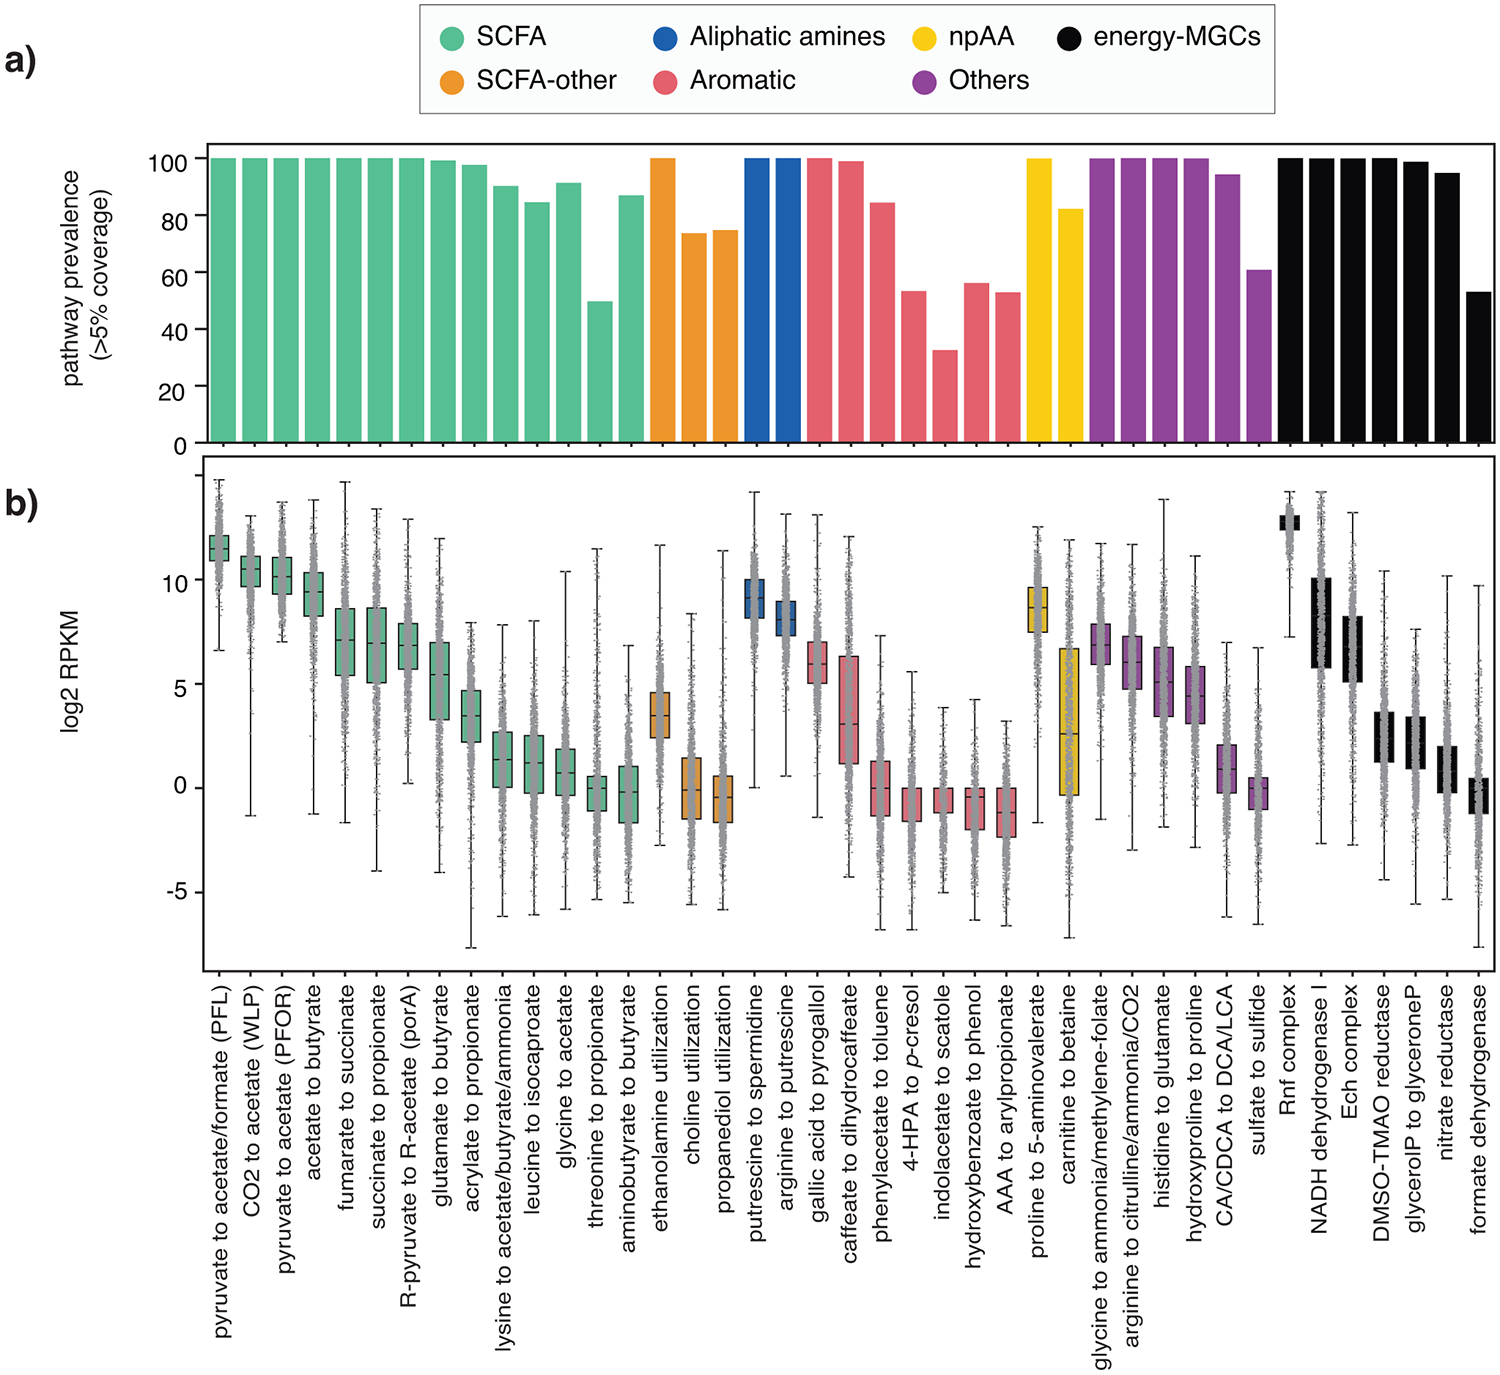
Figure 3. Prevalence and abundance of specialized primary metabolic pathways across 1,135 human microbiome samples.

(a) Prevalence of each of the 41 known MGC-encoded pathway classes across all microbiomes, measured as the percentage of samples in which core enzyme-coding genes of at least one reference MGC belonging to a given class were covered by metagenomic reads across >5% of their sequence length. This cutoff was kept low to avoid false negatives due to limited sequencing depth for low-abundance taxa (raw data available at Table S7). (b) Distributions of log2 RPKM relative abundance values of all 41 known pathway classes, categorized by product class, across all LifeLines DEEP metagenomes (n=1,135; raw count data available at Table S8). All samples are represented by a dot in the box plot, representing the log2 RPKM value for a given sample. The box limits indicate the quartiles of the dataset while the whiskers extend to 1.5x the interquartile range; center line denotes the median.
