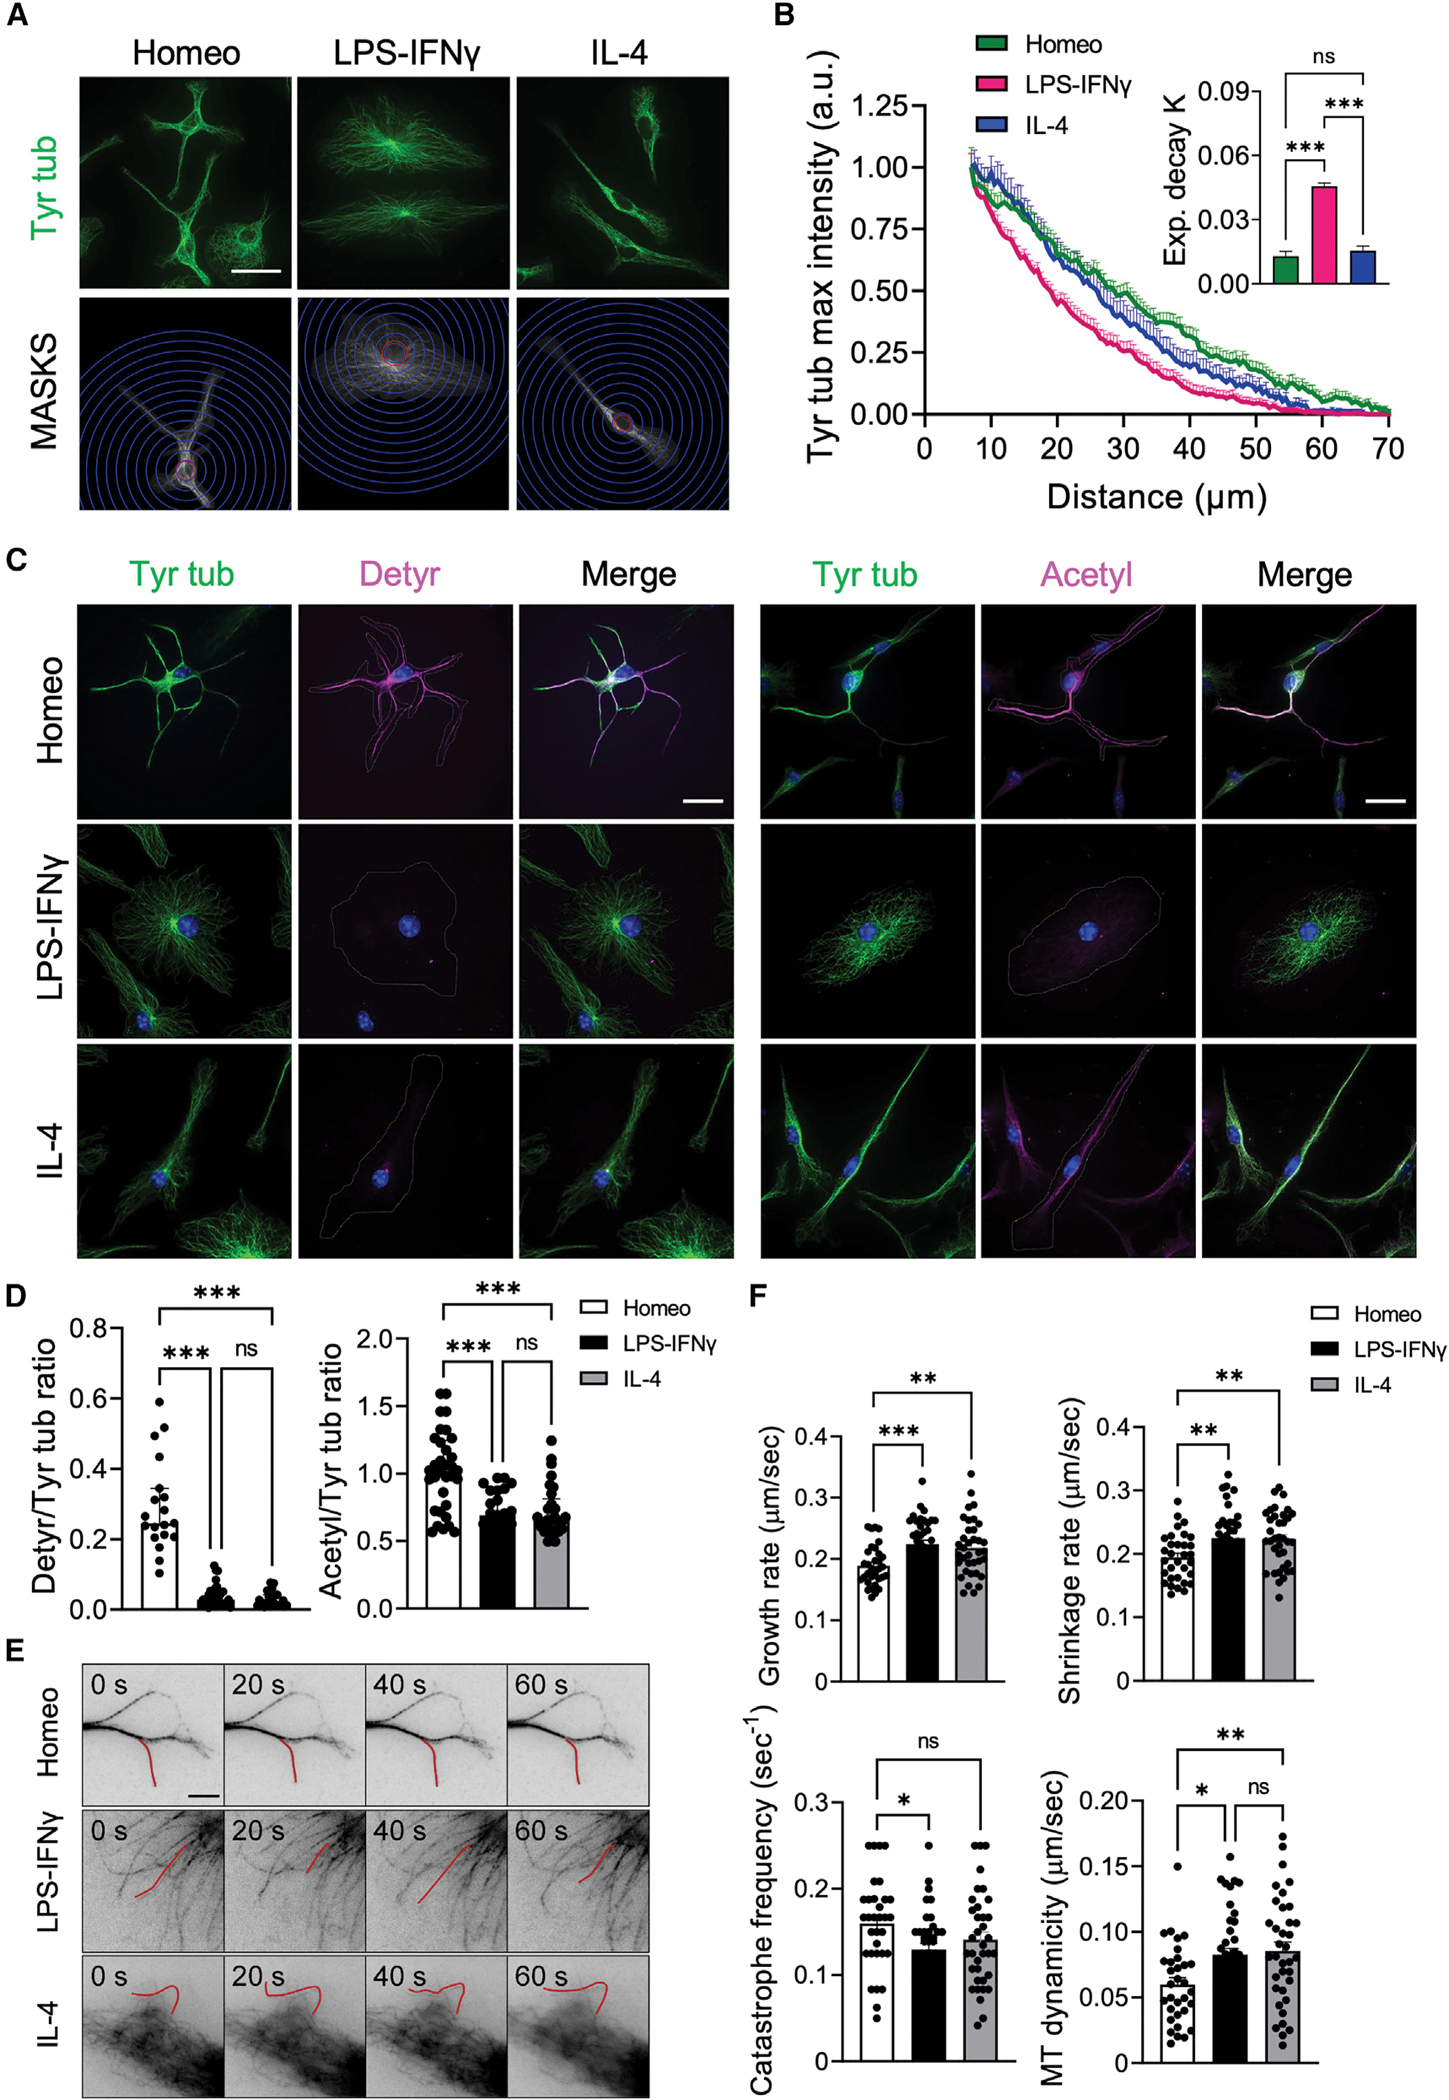
Figure 2. Homeostatic, activated, and alternatively activated primary microglia differ in MT distribution, stability, and dynamic behavior.

(A) Representative IF images of tyrosinated α-tubulin (Tyr tub, green) staining in homeostatic (Homeo), activated (LPS-IFNγ), and alternatively activated (IL-4) microglia (top; scale bar, 20 μm) and corresponding masks (MASKS) used for the analysis (bottom), with radial scale (unit = 5 μm; blue circles) centered at the centroid of the cell nucleus. Red circle indicates the radius corresponding to the largest intensity value.
(B) Plot showing maximum fluorescence intensity values of Tyr tub versus the radial distance from cell nucleus, obtained with radial profiling, in Homeo (n = 38, green), LPS-IFNγ (n = 31, magenta), or IL-4 (n = 38, blue) treated microglia. Curve fit was performed using a single exponential decay function. Inset: bar chart reporting the exponential decay constant values (K) for each condition (values are expressed as mean ± SEM from 4 independent experiments; ns, not significant; ***p < 0.001, one-way ANOVA with Tukey’s multiple comparison test). Note faster decay of Tyr tub signal in activated microglia.
(C) Representative IF images of Homeo-, LPS-IFNγ-, or IL-4-treated microglia. Left: co-staining of Tyr tub (green) and detyrosinated tubulin (Detyr, magenta) (Hoechst for nuclei visualization, blue; scale bar: 20 μm). Right: co-staining of Tyr tub (green) and acetylated tubulin (Acetyl, magenta) (Hoechst for nuclei visualization, blue; scale bar, 20 μm).
(D) Scatter dot plots showing IF signal quantification of detyrosinated/tyrosinated (Detyr/Tyr) tub ratio (left; Homeo n = 19, LPS-IFNγ n = 32, IL-4 n = 28 cells from 3 independent experiments) and acetylated/tyrosinated (Acetyl/Tyr) tubulin ratio (right; Homeo n = 33, LPS-IFNγ n = 25, IL-4 n = 29 cells from 3 independent experiments). Values are expressed as median ± interquartile range. ns, not significant; ***p < 0.001, Kruskall-Wallis with Dunn’s multiple comparisons test. Note that microglia challenged with LPS-IFNγ or IL-4 have reduced tubulin PTM levels compared with Homeo cells.
(E) Representative inverted contrast wide-field frames from time-lapse acquisitions of SiR-Tubulin in Homeo-, LPS-IFNγ-, or IL-4-treated microglia at four different time points (0 s, 20 s, 40 s, and 60 s). Red lines highlight MT length changes ≥0.5 μm between frames. Scale bar, 5 μm.
(F) Scatter dot plots representing growth rate (top, left), shrinkage rate (top, right), catastrophe frequency (bottom, left) and MT dynamicity (bottom, right) in Homeo, LPS-IFNγ, and IL-4 microglia. Values are expressed as mean ± SEM (Homeo n = 30, LPS-IFNγ n = 27, IL-4 n = 29 cells from 4 independent experiments). ns, not significant; ***p < 0.001, **p < 0.01, *p < 0.05, one-way ANOVA with Dunnett’s multiple comparisons test.
