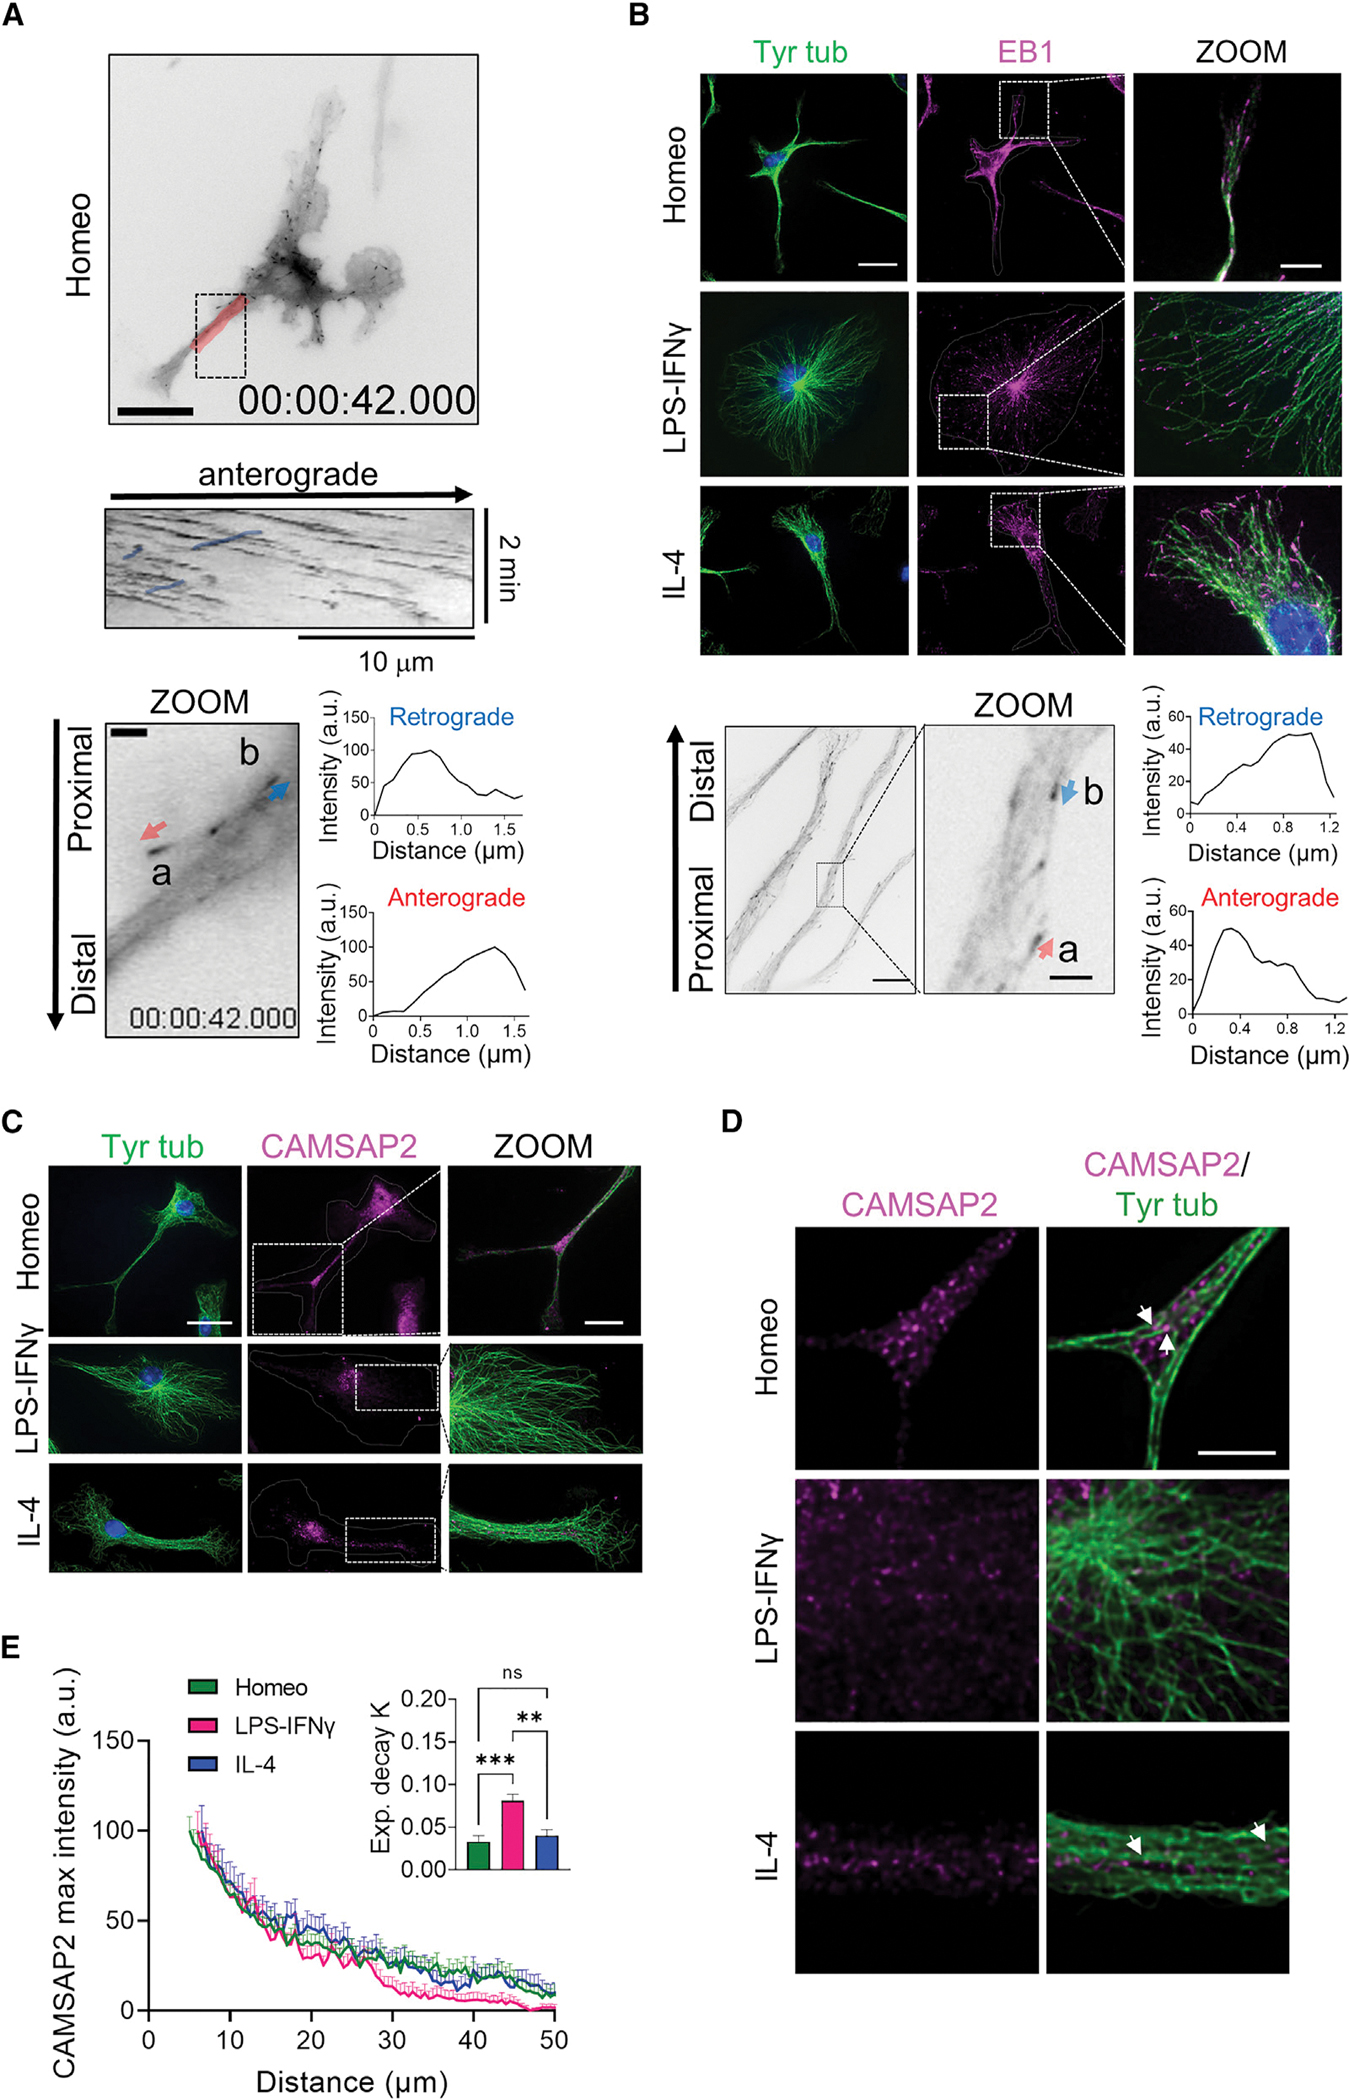
Figure 3. Homeostatic, activated, and alternatively activated primary microglia differ in MT orientation.

(A) Top: representative inverted contrast wide-field frames from time-lapse acquisitions of EB3-EGFP-infected homeostatic (Homeo) microglia (scale bar, 20 μm) and kymograph of the selected region in red (middle). Note that retrograde comets in the kymograph are highlighted in blue. Bottom: inverted contrast single frame image of EB3-EGFP at higher magnification (scale bar, 2 μm). Relative orientation of EB3 comet peaks with respect to the cell nucleus was used to distinguish between EB3 anterograde (a, red arrow) and retrograde (b, blue arrow) comets.
(B) Top: representative IF images of EB1 (magenta) and tyrosinated α-tubulin (Tyr tub) (green) in homeostatic (Homeo), activated (LPS-IFNγ), and alternatively activated (IL-4) microglia. Hoechst for nuclei visualization, blue. Scale bar, 20 μm (5 μm in zoom images). Bottom left: representative inverted contrast single plane image of EB1 IF (scale bar, 10 μm). Bottom middle: direction of EB1 signal gradient relative to the cell nucleus was used to identify EB1 anterograde (a, red arrow) and retrograde (b, blue arrow) comets (scale bar, 2 μm). Bottom right: intensity profiles of anterograde (lower) and retrograde (upper) comets.
(C) Representative z-projection confocal images showing CAMSAP2 (magenta) and Tyr tub (green) signal in Homeo-, LPS-IFNγ-, or IL-4-treated microglia. Hoechst for nuclei visualization, blue. Scale bar, 20 μm (5 μm in zoom images).
(D) Single confocal planes at higher magnification of CAMSAP2 (magenta) and Tyr tub (green) signal in Homeo-, LPS-IFNγ-, or IL-4-treated microglia. Note that CAMSAP2 signal is present in microglia processes in Homeo- and IL-4-treated cells. Scale bar, 5 μm.
(E) Plot showing maximum fluorescence intensity values of CAMSAP2 versus the radial distance from cell nucleus, obtained with radial profiling, in Homeo (n = 18 cells, green), LPS-IFNγ (n = 14 cells, magenta), or IL-4 (n = 19 cells, blue) treated microglia. Curve fit was performed using single exponential decay function. Inset: bar chart reporting the exponential decay constant values (K) for each condition (values are expressed as mean ± SEM from 4 independent experiments; ns, not significant; ***p < 0.001, **p < 0.01, one-way ANOVA with Tukey’s multiple comparisons test).
