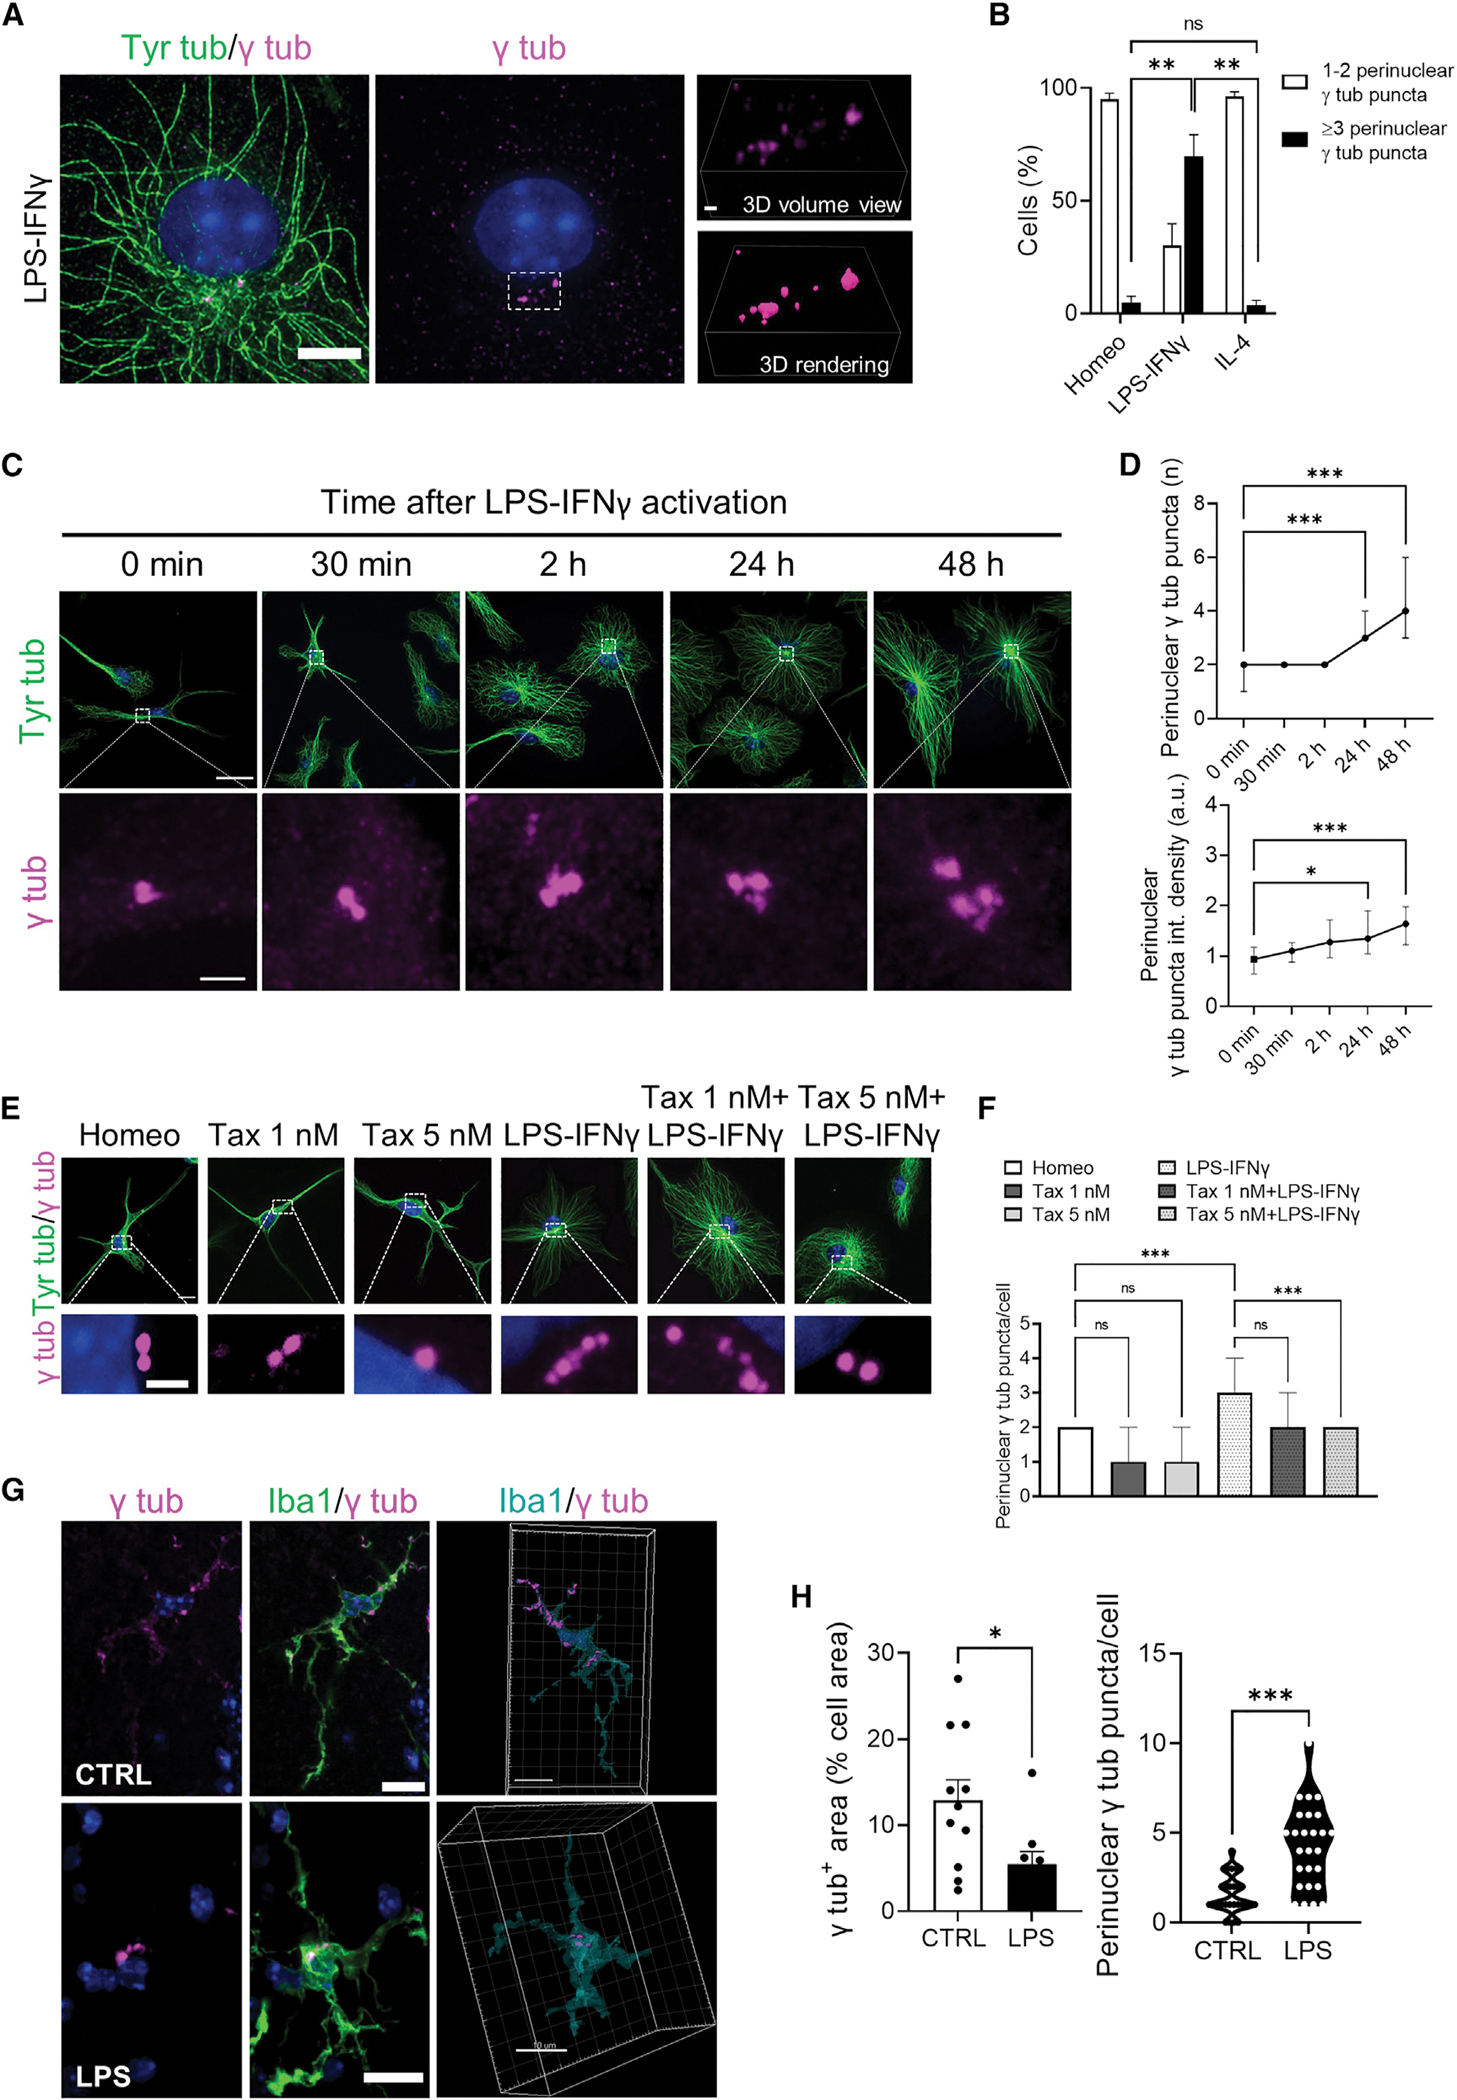
Figure 5. Redistribution of pericentriolar material is a hallmark of activated microglia in vitro and in vivo.

(A) Representative confocal images showing γ-tubulin (γ tub) puncta (magenta) and tyrosinated α-tubulin (left; Tyr Tub, green) immunolabeling in activated (LPS-IFNγ) microglia (middle). Hoechst for nuclei visualization, blue. Scale bar, 5 μm. Right: relative volume view (top) and 3D rendering (bottom) of γ tub puncta (magenta) acquired via structured illumination microscopy. Scale bar 1 μm.
(B) Bar chart reporting the percentage of cells displaying 1–2 γ tub puncta (white bars) or >3 γ tub puncta (black bars) in homeostatic (Homeo), activated (LPS-IFNγ), or alternatively activated (IL-4) microglia. Values are expressed as mean ± SEM from 3 independent experiments. ns, not significant; **p < 0.01, one-way ANOVA with Dunnett’s multiple comparisons test.
(C) Time course of γ tub redistribution during microglia activation: representative IF images showing γ tub (magenta) and tyrosinated α-tubulin (Tyr tub, green) staining at different time points (0 min, 30 min, 2 h, 24 h, and 48 h). Hoechst for nuclei visualization, blue. Scale bar, 20 μm (2 μm in zoom images).
(D) Time course of number of γ tub puncta per cell (top) and quantification of γ tub puncta fluorescence intensity (bottom) during microglia activation. Values are expressed as median ± interquartile range (T0 n = 32; T30 min n = 40; T2h n = 44; T24 h n = 41; T48 h n = 33; from 3 independent experiments). ***p < 0.001, **p < 0.01, *p < 0.05, Kruskal-Wallis with Dunn’s multiple comparisons test with respect to T0.
(E) Representative IF images of tyrosinated Tyr tub (green) and γ tub (magenta) in homeostatic (Homeo), taxol 1 nM treated (Tax 1 nM), Taxol 5 nM treated (Tax 5 nM), activated (LPS-IFNγ), Taxol 1 nM + LPS-IFNγ treated (Tax 1 nM + LPS-IFNγ), and Taxol 5 nM + LPS-IFNγ treated (Tax 5 nM + LPS-IFNγ) microglia. Hoechst for nuclei visualization, blue. Scale bar, 10 μm (2 μm in zoom images).
(F) Bar chart reporting the number of γ tub puncta per cell in Homeo, Tax 1 nM, Tax 5nM, LPS-IFNγ, Tax 1 nM + LPS-IFNγ, and Tax 5 nM + LPS-IFNγ microglia. Values are expressed as median ± interquartile range from 3 independent experiments. ns, not significant; ***p < 0.001, Kruskall-Wallis with Dunn’s multiple comparisons test.
(G) Left: representative maximum intensity projections of images in retinal slices (50 μm thickness) from control (CTRL) and LPS-treated mice stained for γ tub (magenta) and Iba-1 (green) antibodies. Hoechst for nuclei visualization, blue. Scale bar, 10 μm. Right: 3D rendering highlighting the intracellular distribution of γ tub in CTRL (sham) and LPS-treated mice. Scale bars, 10 μm.
(H) Left: scatter dot plot showing the γ tub signal over the cell area of retinal microglia from CTRL (sham) and LPS-treated mice. Values are expressed as mean ± SEM of n = 11/3 cells/mice (CTRL) and n = 9/3 cells/mice (LPS). *p < 0.05, Student’s t test. Right: violin plot showing the number of γ tub puncta per microglia in retinal slices from CTRL and LPS-treated mice of n = 28/3 cells/mice (CTRL) and n = 26/3 cells/mice (LPS). ***p < 0.001, Student’s t test.
