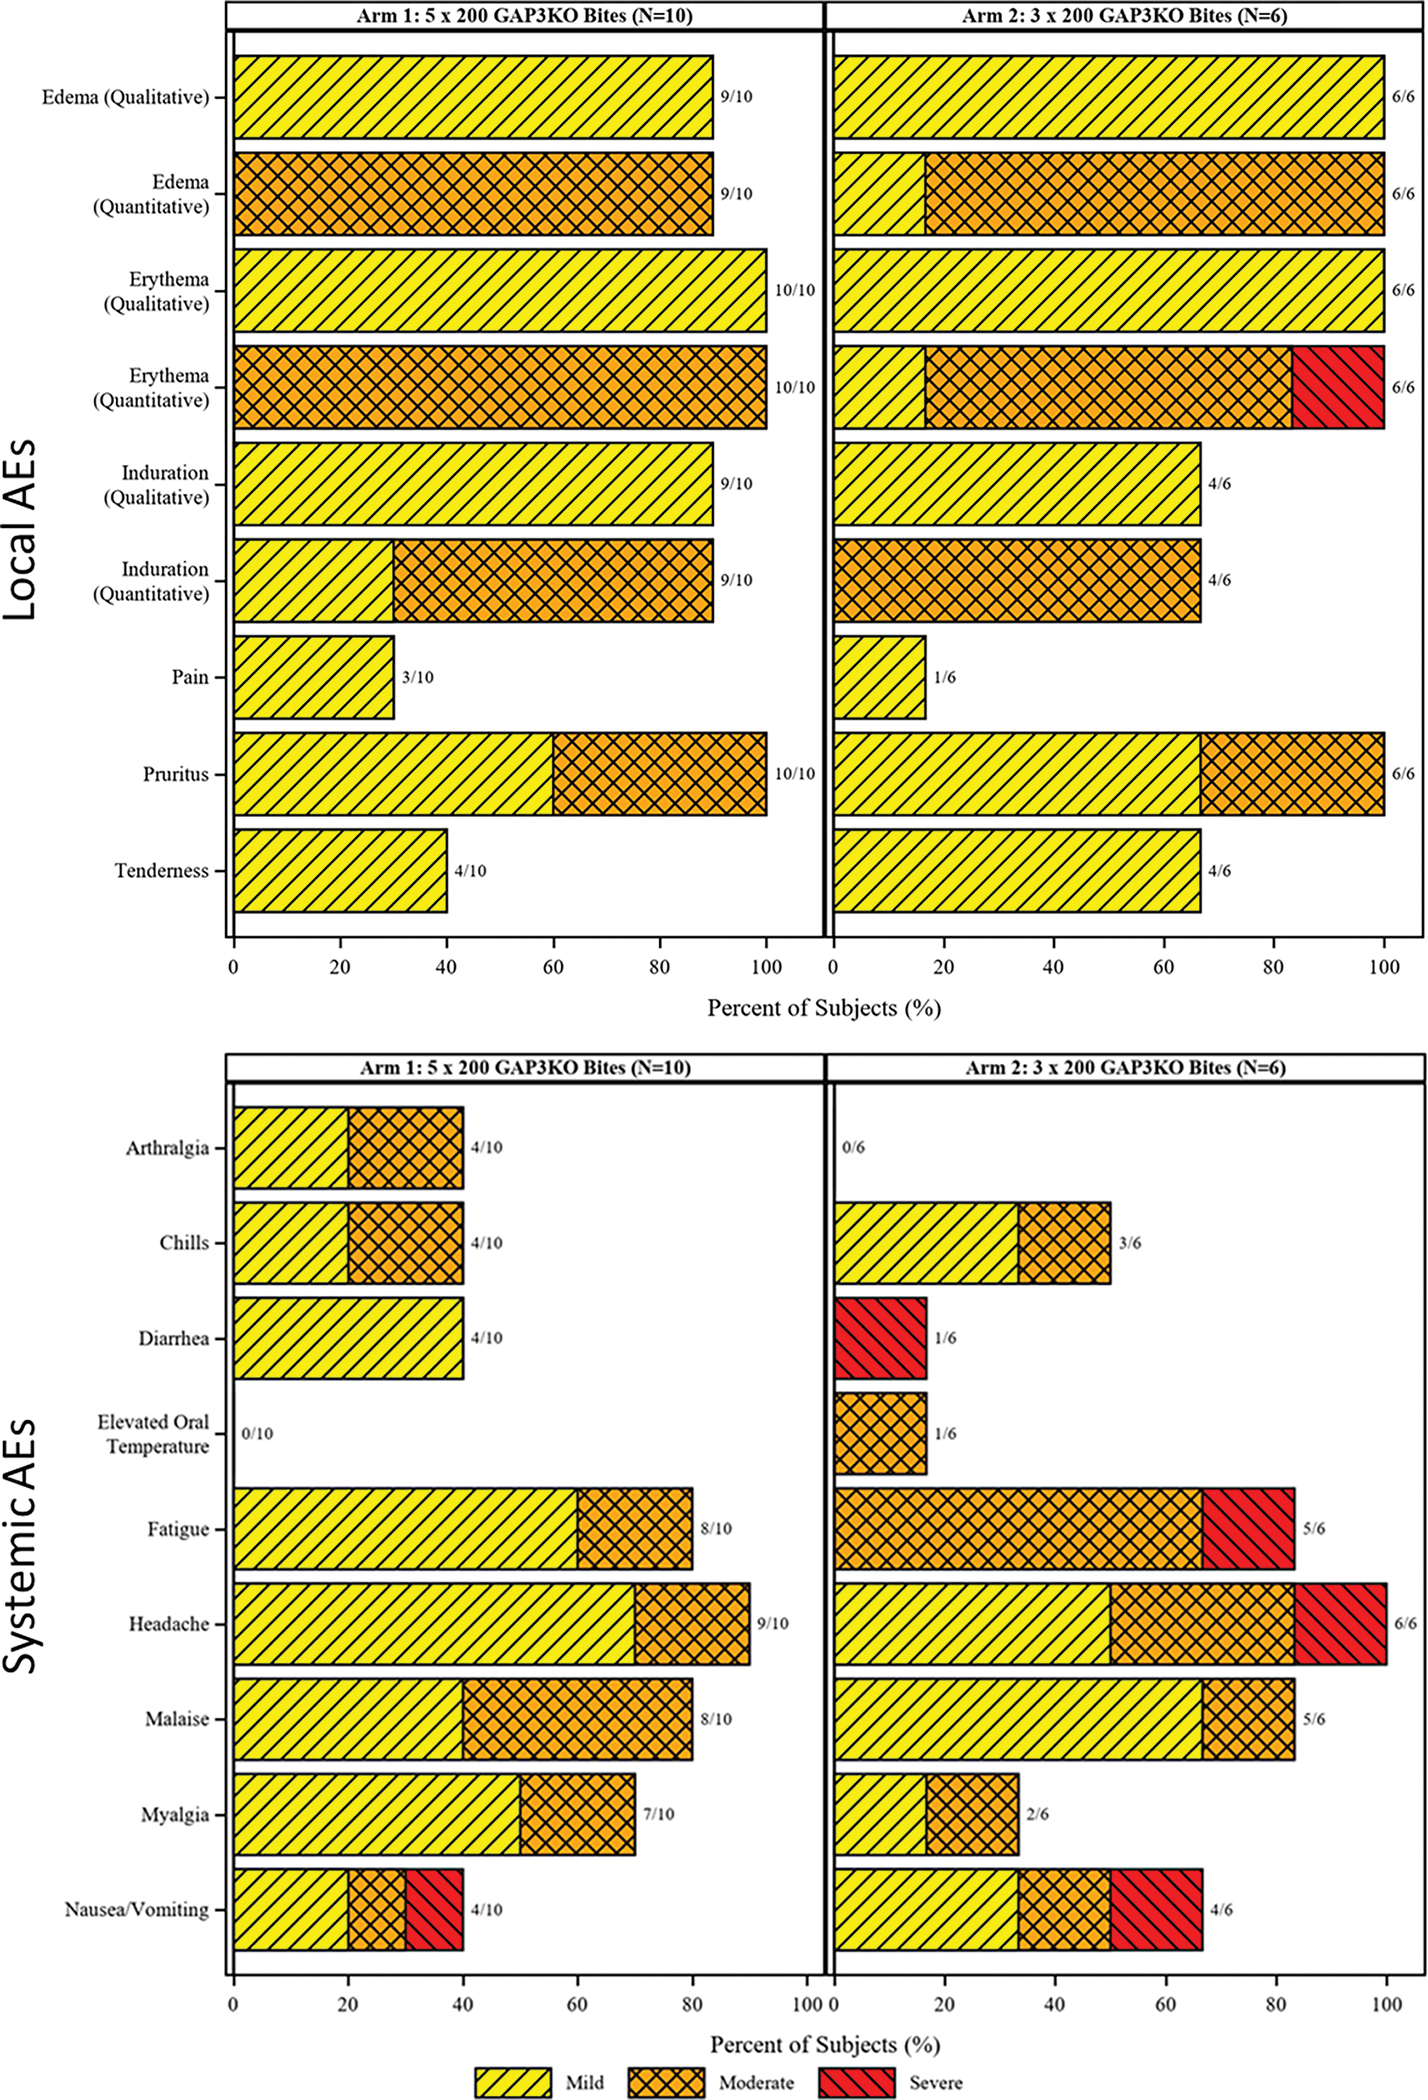
Figure 3. Frequency and maximum severity of local and systemic AEs during vaccination phase.

Local (top) and systemic (bottom) AEs are shown as a histogram for study participants in Arm 1 (left) and Arm 2 (right). Grading is shown as in the key and the number of study participants with each listed AE are listed in the bar labels.
