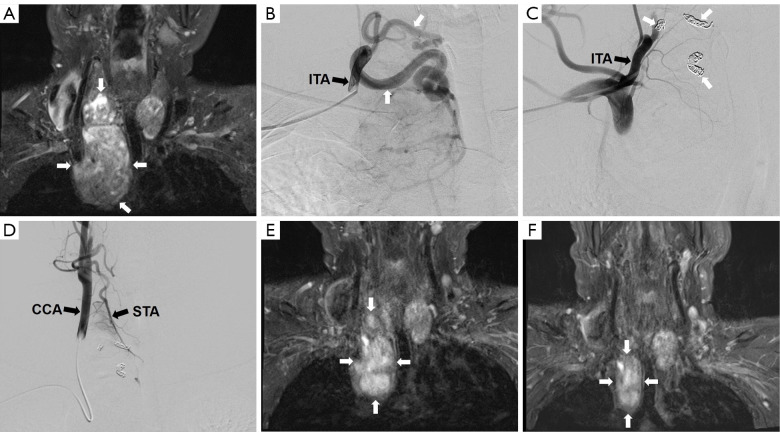
Figure 1.
A 42-year-old man with a large solitary nodule in the right thyroid lobe receiving transradial approach thyroid artery embolization. (A,E,F) MRI T2WI coronal image of the treated thyroid nodule. (B,C,D) Angiogram of transradial approach thyroid artery embolization. The MRI T2WI image (A) indicates a nodule (white arrows) measuring 5.2 cm × 5.5 cm × 11.2 cm (volume, 170.5 mL). Transradial access selective anteroposterior right ITA angiogram (black arrow) (B) indicates two feeding arteries (white arrows) from right ITA and then embolized with particle and coils (C, white arrows). The post-embolization angiogram from right ITA (C, black arrow) indicates total occlusion of feeding arteries. (D) Selective anteroposterior right CCA angiogram indicates no blood supply from right STA of the thyroid nodule. At 1 month (E) and 3 months (F), the follow-up MRI T2WI indicates shrinkage of the nodule in the right lobe measuring 3.9 cm × 5.5 cm × 8.2 cm (E, white arrows, volume, 91.5 mL; VRR, 46.4%) and 3.4 cm × 2.1 cm × 5.3 cm (F, white arrows, volume, 22.9 mL; VRR, 86.6%), respectively. Volume is calculated as follows: ROI is manually defined on MRI. ROI area measurements for each slice are multiplied by the image slice thickness and sum to generate volumes. MRI, magnetic resonance imaging; ITA, inferior thyroid artery; CCA, common carotid artery; STA, superior thyroid artery; VRR, volume reduction rate; ROI, regions of interest.

