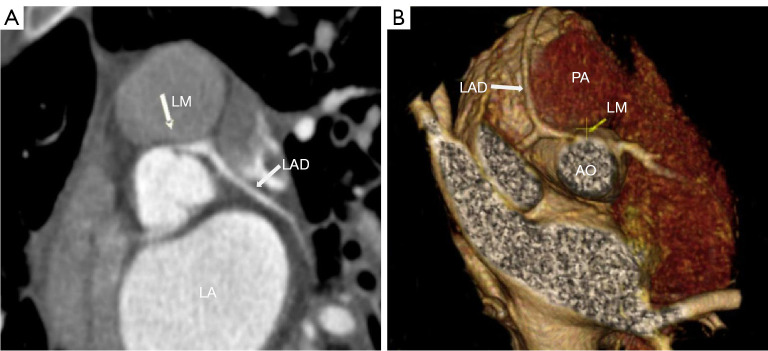
Figure 2.
Axial view (A) and 3D volume-rendering image (B) of CTA showing the starting point and the course of the LM (arrow) relative to the AO and the PA. LM, left main coronary artery; LAD, left anterior descending artery; LA, left atrium; PA, pulmonary artery; AO, aorta; CTA, computed tomography angiography.

