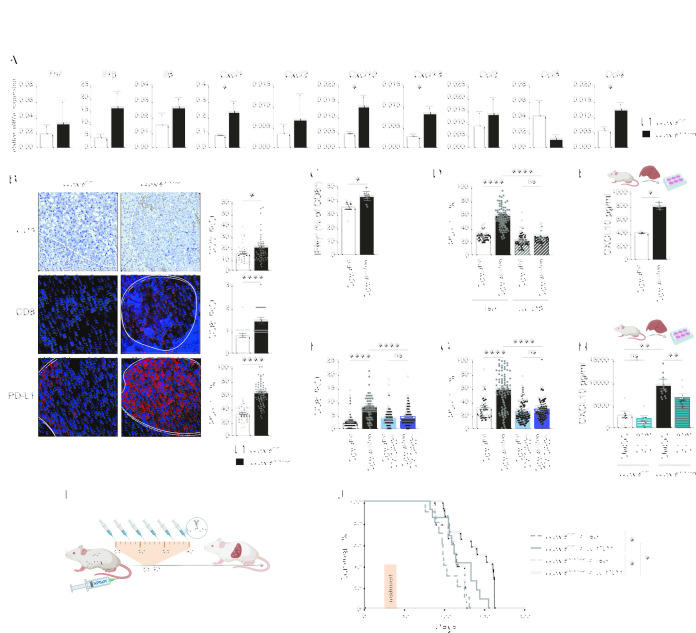
Figure 2.
Ferroptosis in HCC induces immune reaction with T cell activation dampened by PD-L1 upregulation. (A) Gene expression quantification by quantitative RT-PCR in tumours from Gpx4 F/F and Gpx4 Δ/Δhep mice 25 days after HTVI (n=5). (B) Immunohistochemical analysis of CD3+ (n=35), CD8 (n≥36), PD-L1+ (n=38) cells in HCC tumours of Gpx4 F/F and Gpx4 Δ/Δhep mice after HTVI. Scale bars=100 µm. (C) Flow cytometry analysis of IFNγ expression in CD8 T cells from liver of Gpx4 F/F and Gpx4 Δ/Δhep tumour bearing mice after PMA/Ionomycin stimulation (n≥4). (D) Immunofluorescence quantification of PD-L1 expression in HCC tumours from Gpx4 F/F and Gpx4 Δ/Δhep mice treated with depleting α-CD8 or Rat IgG2b, κ antibodies (n≥42). (E) CXCL10 release by primary hepatocytes from Gpx4 F/F and Gpx4 Δ/Δhep mice ex vivo for 4 hours (n=2). (F, G) Immunofluorescence quantification of CD8+ T cells infiltration (F) and PD-L1 expression (G) in HCC tumours from Gpx4 F/F, Gpx4 Δ/Δhep, Gpx4 F/F CXCR3 -/-, Gpx4 Δ/Δhep CXCR3 -/- mice (n≥40). (H) CXCL10 secretion by Gpx4 F/F and Gpx4 Δ/Δhep primary hepatocytes ex vivo treated with 10 µM of C176 and C178 or DMSO for 4 hour (n≥6). (I) Treatment scheme for i.p. injections, of α-PD-1 or isotype (Rat IgG2a,κ). (J) Survival of Gpx4 F/F+ isotype (Rat IgG2a,κ) (n=10), Gpx4 F/F + α-PD-1 (n=13), Gpx4 Δ/Δhep + isotype (Rat IgG2a,κ) (n=9) and Gpx4 Δ/Δhep +α-PD-1 (n=14) mice with HCC tumours. (A–H) Data are mean±SEM, n.s not significant *p≤0.05, **p≤0.01, ****p≤0.0001 by t-test (A–C, E) or one-way ANOVA with Šídák’s multiple comparisons test (D, F–H) of the indicated pairs or by log-rank (Mantel-Cox) test (J). ANOVA, analysis of variance; HTVI, hydrodynamic tail vein injection; PMA, phorbol myristate acetate.

