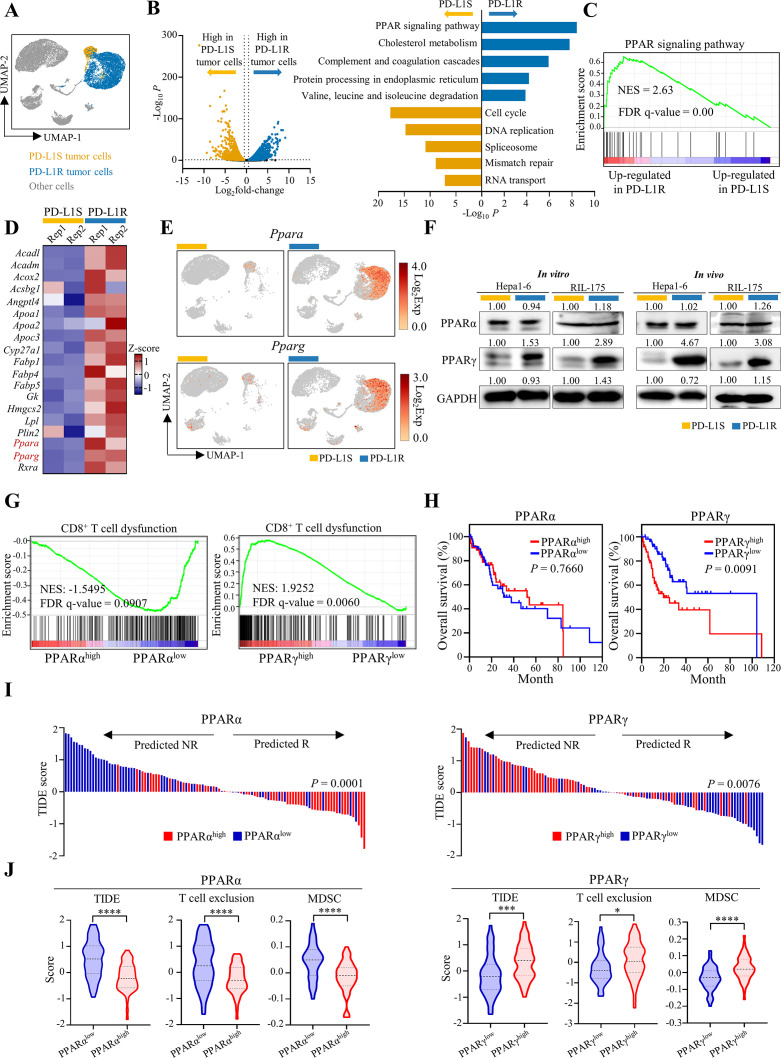
Figure 2.
Adaptive upregulation of PPARγ correlates with immune dysregulation in mouse models and patients with HCC. (A) ScRNA-seq analysis of tumour cell clusters from Hepa1-6-PD-L1S and PD-L1R tumours with anti-PD-L1 treatment (n=2 per group). UMAP plot of the identified tumour cells. (B) Volcano plot of differentially expressed genes (DEGs; left; Log2fold-change >0.5 and p<0.05) and KEGG pathway enrichment analysis for top five enriched pathways of DEGs (right; Log2fold-change>0.5, p<0.05 and normalised expression >0.1) in anti-PD-L1-treated PD-L1S (orange bar) or PD-L1R tumour cells (blue bar), respectively. (C) GSEA plot of PPAR signalling pathway (KEGG) in PD-L1R tumour cells compared with PD-L1S tumour cells. (D) Heatmap showing z-score transformed expression of PPAR-related genes identified in (B) in PD-L1S or PD-L1R tumour cells from each sample. (E) UMAP plots of expression patterns of Ppara (top) and Pparg (bottom) in PD-L1S and PD-L1R single cells. (F) Representative western blot analysis of PPARα and PPARγ in Hepa1-6 or RIL-175-PD-L1S and -PD-L1R cell lines and anti-PD-L1-treated tumour tissues. GAPDH served as loading control. (G) TCGA HCC samples with high (n=55) and low (n=55) mRNA levels of PPARA or PPARG that were stratified by top and bottom 15% in 369 patients were selected for subsequent analysis. GSEA plots of CD8+ T cell dysfunction signature in patients with TCGA HCC with high and low expressions of PPARA or PPARG. (H) Kaplan-Meier curves of overall survival in patients with HCC according to the expression of PPARA or PPARG. (I) Prediction of potential clinical ICB response in patients with PPARαhigh versus PPARαlow or PPARγhigh versus PPARγlow HCC using the TIDE signature. (J) Analysis of TIDE, T cell exclusion and MDSC scores by TIDE algorithm in patients with PPARαhigh and PPARαlow or PPARγhigh and PPARγlow HCC. Statistical significance was assessed by two-sided log-rank (Mantel-Cox) test for (H), by two-sided χ² test for (I) and by unpaired two-tailed Student’s t-test for (J). *P<0.05; ***p<0.001; ****p<0.0001. DEGs, differentially expressed genes; GSEA, Gene Set Enrichment Analysis; HCC, hepatocellular carcinoma; ICB, immune-checkpoint blockade; KEGG, Kyoto Encyclopedia of Genes and Genomes; MDSC, myeloid-derived suppressor cell; PD-L1R, programmed death-1-ligand-1 resistant; PD-L1S, programmed death-1-ligand-1 sensitive; PPARγ, peroxisome proliferator-activated receptor-gamma; TIDE, Tumor Immune Dysfunction and Exclusion; UMAP, Uniform Manifold Approximation and Projection.

