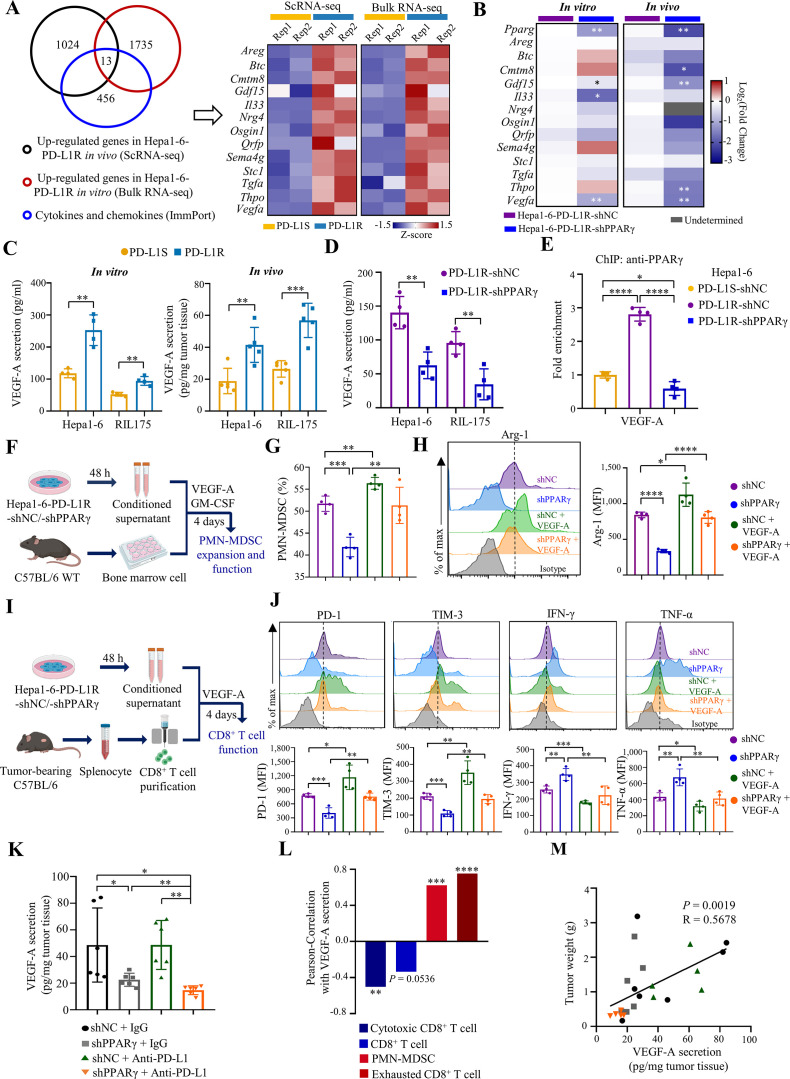
Figure 4.
Tumour-intrinsic PPARγ transcriptionally activates VEGF-A production to remodel TME. (A) Venn diagram of upregulated genes in Hepa1-6-PD-L1R tumour cell clusters (scRNA-seq), Hepa1-6-PD-L1R cell lines from bulk RNA-seq data and cytokines/chemokines from ImmPort. Heatmap showing normalised and z-scored expression of the 13 overlapped genes in scRNA-seq or bulk RNA-seq data, respectively (n=2). (B) Heatmap of relative mRNA levels of Pparg and the 13 indicated candidate genes in Hepa1-6-shNC-tumour and shPPARγ tumour cells (n=4) or tissues (n=5 to 6) are shown. (C) ELISA analysis of VEGF-A secretion levels in cell lines (n=4) and anti-PD-L1-treated tumour tissues (n=5) from Hepa1-6 and RIL-175 models. (D) VEGF-A protein concentration in cell lysates of Hepa1-6 or RIL-175-shNC and shPPARγ cell lines determined by ELISA (n=4). (E) ChIP-qPCR analysis of PPARγ occupancy on the Vegfa promoter region in the indicated cell lines (n=4). Data are normalised to PD-L1S control level. (F) Schematic illustration of PMN-MDSC expansion and functional analysis ex vivo. (G) Proportions of PMN-MDSC in CD45+ cells in indicated groups were assessed by flow cytometry (n=4). (H) Representative overlay histogram and expression levels determined by mean fluorescence intensity (MFI) of Arg-1 in PMN-MDSCs (n=4). (I) Schematic illustration of CD8+ T cell functional assay ex vivo. (J) Representative overlay histogram and MFI of PD-1, TIM-3, IFN-γ and TNF-α in CD8+ T cells (n=4). Dashed line indicates the peak of the Hepa1-6-shNC sample. (K) C57BL/6 mice were intrahepatically injected with Hepa1-6-PD-L1R-shNC or shPPARγ cells (5×10⁶), followed by three doses of treatment with anti-PD-L1 antibody 10F.9G2 or isotype control LTF-2 (10 mg/kg, i.p., every 5 days). Tumours were harvested at the experimental endpoint. VEGF-A secretion levels in tumour tissues were measured from indicated groups. (L) Pearson correlation of immune cell proportions with VEGF-A secretion in tumour tissues. (M) Correlation between VEGF-A secretion in tumour tissues and tumour weight. Data represent as mean±SD. Statistical significance was determined by unpaired two-tailed Student’s t-test. Single-tailed Pearson’s correlation was used to describe the correlation between variables. *P<0.05; **p<0.01; ***p<0.001; ****p<0.0001. ICB, immune-checkpoint blockade; IFN, interferon; MDSC, myeloid-derived suppressor cell; PD-1, programmed cell death protein 1; PMN, polymorphonuclear; PPARγ, peroxisome proliferator-activated receptor-gamma; TME, tumour microenvironment; TNF, tumour necrosis factor.

