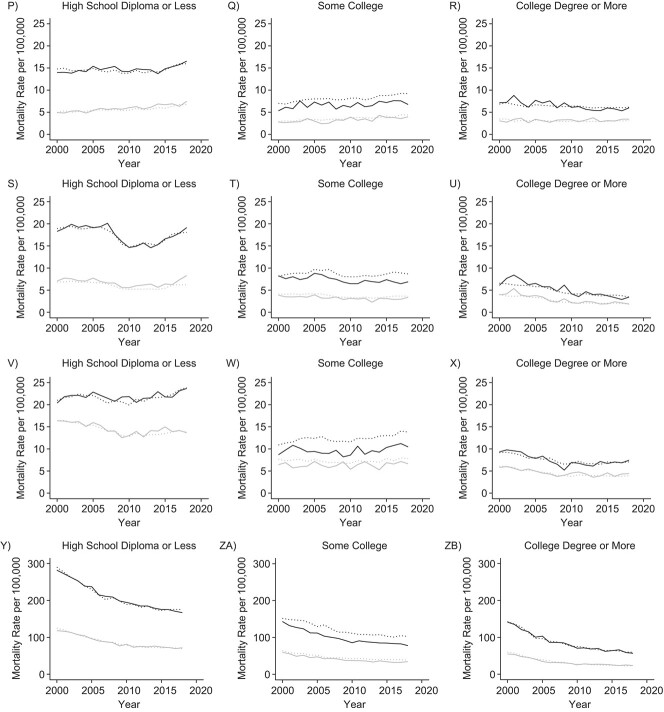
Figure 4.
Age-standardized mortality rates per 100,000 population for 9 cause-of-death categories between 2000 and 2018 as observed (target data; dotted line) and as modeled by microsimulation (solid line), by sex (black, men; gray, women) and educational level (an indicator of socioeconomic status), Simulation of Alcohol Control Policies for Health Equity (SIMAH) Project. Results were age-standardized to the US population in 2018. Panels A–C, alcohol use disorders; panels D–F, hypertensive heart disease; panels G–I, stroke; panels J–L, liver cirrhosis; panels M–O, suicide; panels P–R, other unintentional injury; panels S–U, motor vehicle accidents; panels V–X, diabetes; panels Y–ZB, ischemic heart disease. “Stroke” represents ischemic stroke; “liver cirrhosis” includes liver disease and cirrhosis.

