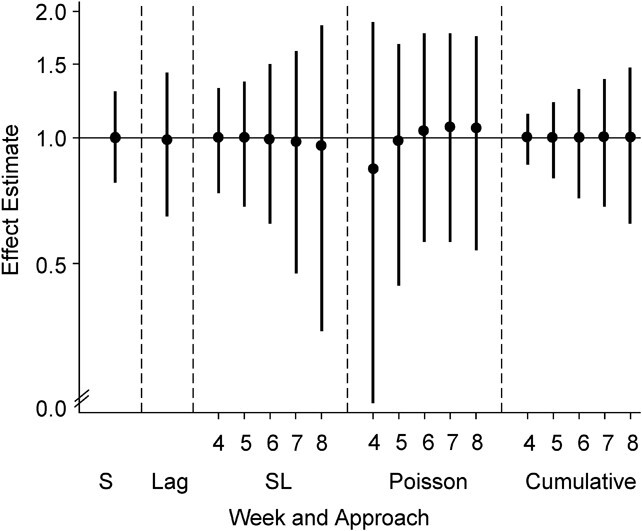
Figure 1.

Distribution of effect estimates from 5 modeling approaches in 1,000 simulation trials when exposure is not related to miscarriage risk (relationship 1). Black circles represent the 50th percentile, and the intervals (vertical bars) span the 5th–95th percentile range of simulated effect estimates (hazard ratios from Cox models, odds ratios from logistic regression models, and incidence rate ratios from Poisson models). The solid line indicates the true effect in the data set. The simulations used data on alcohol consumption patterns from the Right From the Start cohort study, United States, 2000–2012. S, simple; SL, sequential.
