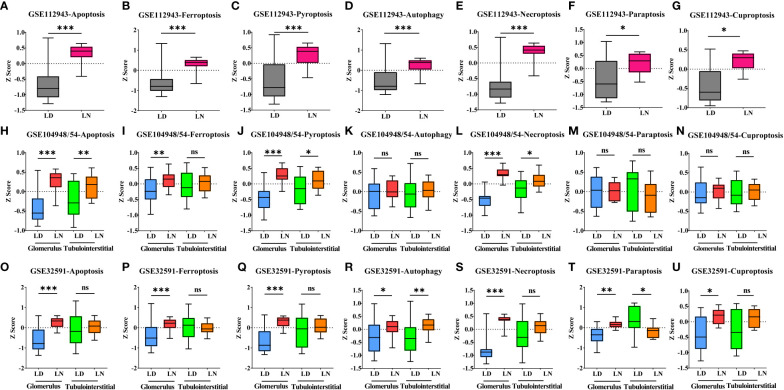
Figure 1.
Alteration of seven types of PCD in living donors and lupus nephritis patients. (A–G). Bar graph of apoptosis (A), ferroptosis (B), pyroptosis (C), autophagy (D), necroptosis (E), paraptosis (F), and cuproptosis (G) gene expression within the whole kidney in the GSE112943 cohort. (H–N) Bar graph of apoptosis (H), ferroptosis (I), pyroptosis (J), autophagy (K), necroptosis (L), paraptosis (M), and cuproptosis (N) gene expression within the glomerular and tubulointerstitial compartments in the GSE104948/54 cohort. (O–U) Bar graph of apoptosis (O), ferroptosis (P), pyroptosis (Q), autophagy (R), necroptosis (S), paraptosis (T), and cuproptosis (U) gene expression within the glomerular and tubulointerstitial compartments in the GSE32591 cohort. *p < 0.05; **p < 0.01; ***p < 0.001; ns, not significant. Values of p < 0.05 were considered significant. PCD, programmed cell death.

