
Fig. 2.
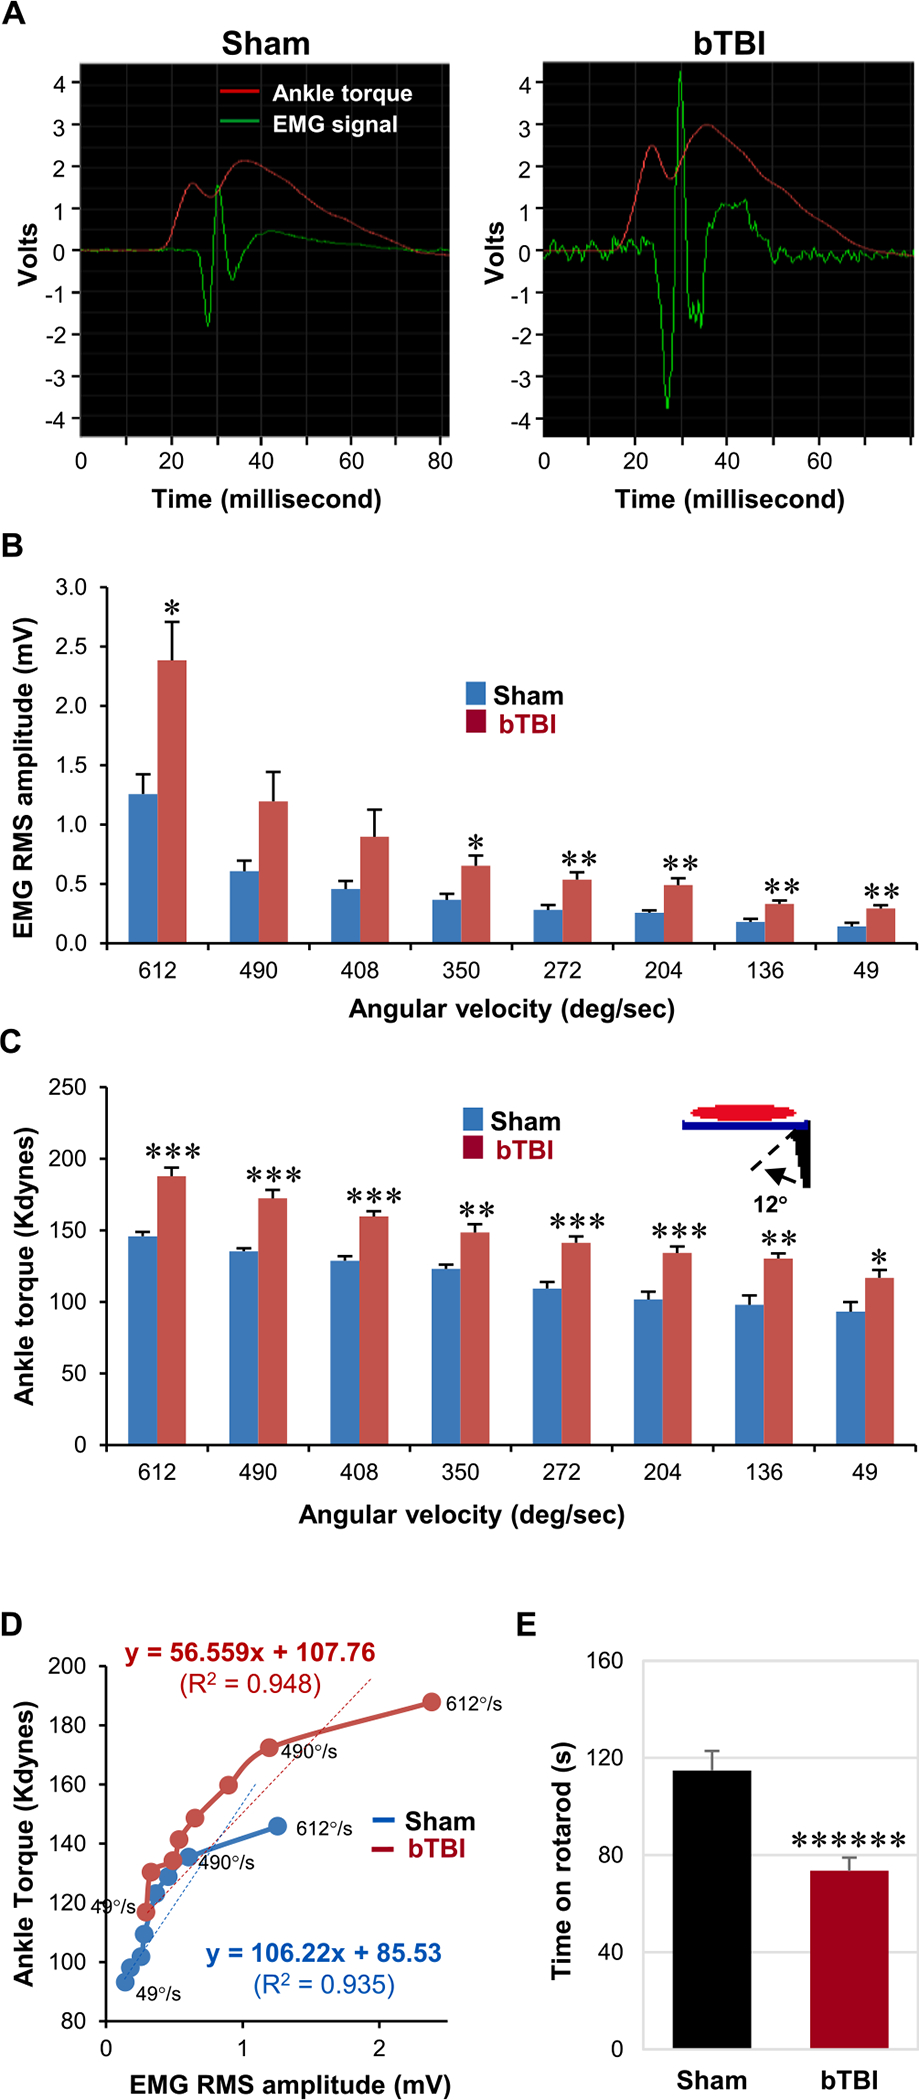
Analysis of bTBI-induced spasticity and balance/motor deficit after acute repetitive bTBI. (A) Representative electromyograms of EMG signals (green) time-locked to the VDAT (red) during stretch reflexes (i.e., dorsiflexion) of the animals in the sham and bTBI groups. Notice the sudden elevation of EMG signals followed by gradual increase in the VDAT in both groups. (B) EMG root mean square (RMS) amplitude during 12°-dorsiflexion at various velocities (612°, 490°, 408°, 350°, 272°, 204°, 136°, and 49° per second). At 612°, 350°, 272°, 204°, 136°, and 49° per second, the EMG RMS amplitude was significantly elevated following injury. (C) VDAT during the dorsiflexion at various velocities. At all tested velocities, the VDAT was significantly elevated following injury. (D) VDAT plotted as a function of EMG RMS amplitude. The slope reflects the efficiency of the neuronal inputs (i.e., EMG) in producing the mechanical outputs (i.e., VDAT). The slope was relatively constant at lower velocities of dorsiflexion but was decreased at higher velocities (beyond 490° per second) in both groups. Regression lines formatted through the initial 7 velocities revealed R2 values of 0.935 and 0.948, respectively, for sham and bTBI groups. (E) Rotarod performance after repetitive bTBI. bTBI animals showed significant balance/motor deficit, compared to age-matched sham animals. Seven independent animals were used per group. Values are mean ± SEM. *p < 0.05, **p < 0.01, ***p < 0.001, ******p < 0.000001.