
Fig. 4.
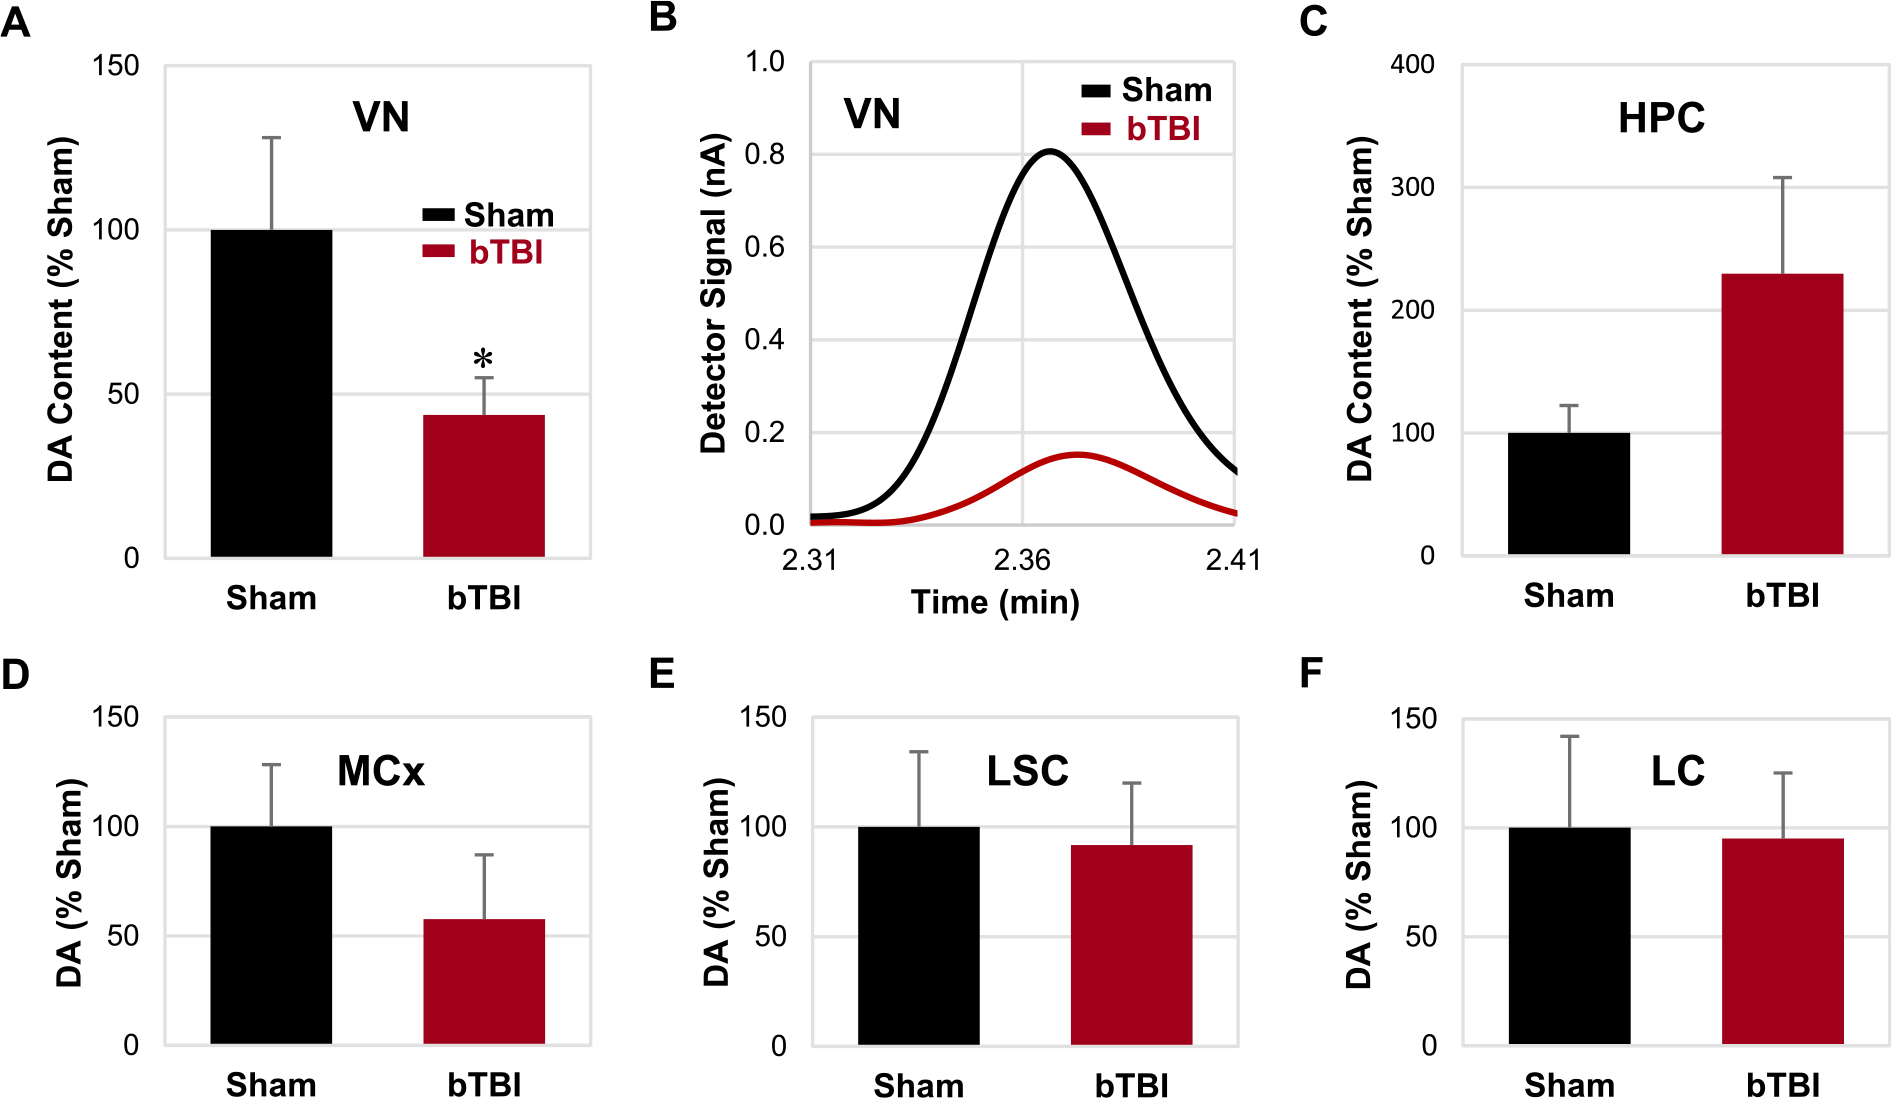
Levels of DA in various central nervous system regions. (A) Relative contents of DA were significantly reduced in the VN following repetitive bTBI compared to the sham animals. (B) Representative chromatograms of the VN in the sham and bTBI animals. (C-F) No significant difference was detected in the HPC, MCx, LSC, and LC. Bar graphs are shown in the order of statistical significance. Seven independent animals were used per group. Values are mean ± SEM. *p < 0.05.