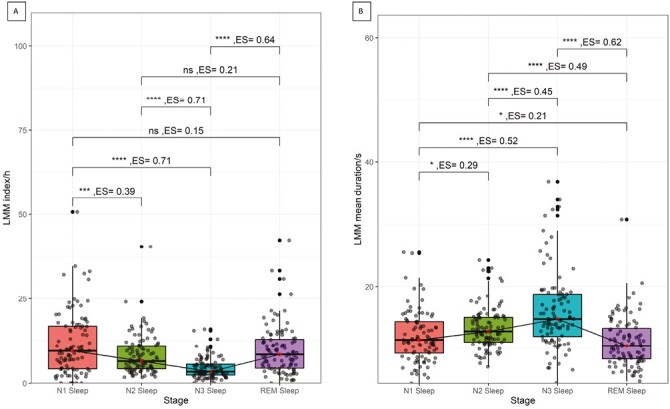
Figure 1.

Distribution of LMMs indices across the different sleep stages. Box and whiskers plot representing LMM indices (A) and mean durations (B) in the different sleep stages. The red dot represents the median, and the whiskers indicate the interquartile range. A line to visualize the trend of change across the sleep stages connects medians. One star means significance < 0.05, 2 stars < 0.01, 3 stars < 0.001, ns means not significant. P-values were corrected for multiple comparisons with the Benjamini–Hochberg procedure. LMM, large muscle group movements; REM, Rapid eye movement.
