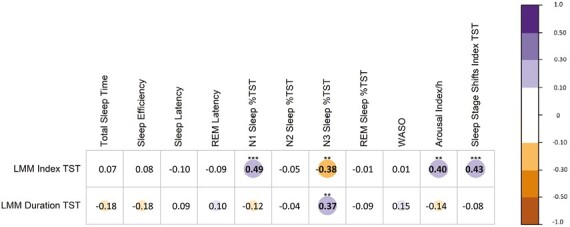
Figure 3.

Correlation between LMMs indices and sleep architecture features. Correlogram representing the correlation between the LMM indices/durations and the sleep architecture- The purple color represents a positive correlation, red represents a negative one. Correlations more than 0.1 are represented with a circle/color as follows: 0.1–0.3 as small, <0.3–0.5 as medium, and > 0.5 as large (Cohen, J. (1988). Statistical Power Analysis for the Behavioral Sciences (second ed.). Erlbaum, Hillsdale, NJ). The number inside the circle shows the correlation coefficient, the P-value is marked above the correlation coefficient, one-star means < 0.05, 2 stars < 0.01, 3 stars < 0.001. All P-values are corrected with the Benjamin–Hochberg procedure. LMM, large muscle group movements; REM, rapid eye movements; WASO, wake after sleep onset.
