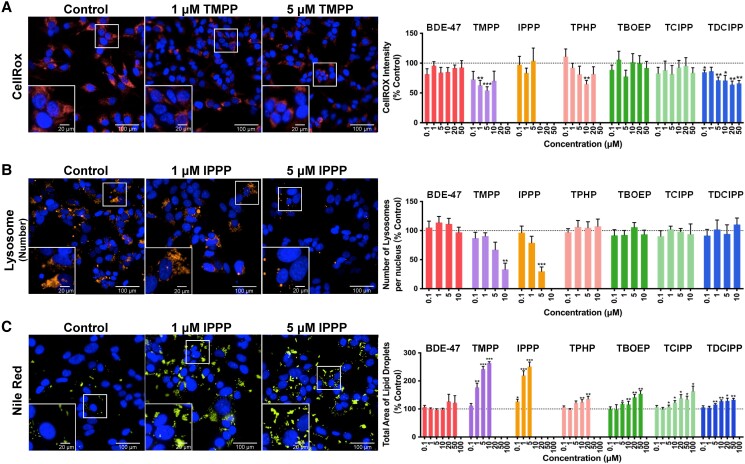
Figure 3.
Effects of 2,2′,4,4′-tetrabromodiphenyl ether (BDE-47) and organophosphate esters (OPEs) on the phenotypic characteristics of H295R cells. Cells were stained with (A) Hoechst 33342 (blue, nuclei) and CellROX (red, an indicator of oxidative stress); (B) Hoechst 33342 (blue, nuclei) and Lysotracker Red (orange, lysosome numbers); (C) Hoechst 33342 (blue, nuclei) and Nile Red (yellow, lipid droplets) fluorescent dyes and were visualized with the Operetta high content imaging system (40× magnification). Data are shown as percentages relative to controls; values represent means ± SEM; n = 6. *P < .05, **P < .01, and ***P < .001 compared to control. Concentrations that induced > 30% cytotoxicity were excluded from the analyses and were not shown.

