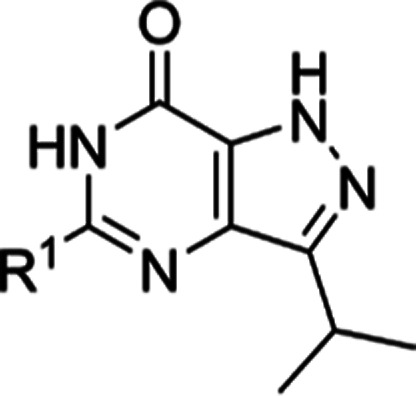
Table 1. Exploration of SAR in the R1 Position.

| code | R1 | MWa | cLogPa | PSAa | T. b. brucei pIC50b | MRC-5 pIC50b |
|---|---|---|---|---|---|---|
| 1 (BIPPO) | Bn | 268.3 | 2.2 | 70.1 | 4.5 ± 0.2 | <4.2 |
| 9 (NPD-2960) | 4-PyCH2 | 269.3 | 1.0 | 83.0 | <4.2 | <4.2 |
| 10 (NPD-0434) | C6H5OCH2 | 284.3 | 2.1 | 79.4 | <4.2 | <4.2 |
| 11 (NPD-3281) | C6H5(CH2)2 | 282.3 | 2.3 | 70.1 | <4.2 | <4.2 |
| 12 (NPD-3380) | Me | 192.2 | 0.7 | 70.1 | <4.2 | <4.2 |
| 13 (NPD-3645) | nBu | 234.3 | 2.1 | 70.1 | 5.0 ± 0.0 | <4.2 |
| 14 (NPD-3379) | iPr | 220.3 | 1.8 | 70.1 | 4.4 ± 0.1 | <4.2 |
| 15 (NPD-3200) | Ph | 254.3 | 2.3 | 70.1 | 6.6 ± 0.2 | <4.2 |
| 16 (NPD-3488) | 4-Py | 255.3 | 1.2 | 83.0 | 5.7 ± 0.0 | <4.2 |
| 17 (NPD-2973) | 4-thiazole | 261.3 | 1.2 | 83.0 | 4.9 ± 0.0 | <4.2 |
cLogP and PSA (polar surface area) are calculated using collaborative drug discovery (CDD).
Mean values of at least two independent experiments.
