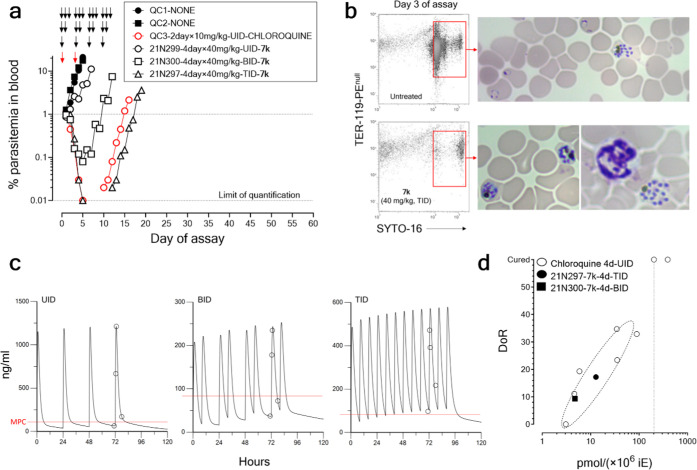
Figure 7.
Therapeutic efficacy of inhibitor 7k against P. falciparumin vivo. (a) Parasitemia in peripheral blood of PfalcHuMice: untreated (QC1 and QC2), treated with chloroquine, or treated with inhibitor 7k at 40 mg/kg, p.o., UID, BID, or TID. (b) Distribution of stages of P. falciparum in peripheral blood of untreated and 7k-treated PfalcHuMice after one parasite cycle of drug exposure (day 3 of the assay). The figure shows flow cytometry plots of human erythrocytes (not stained with the anti-mouse erythrocyte mAb TER-119 conjugated with phycoerythrine) stained with the nucleic acid dye SYTO-16. The red rectangles inside flow cytometry plots indicate the area of viable parasites. The photographs show Giemsa-stained blood smears of the very same cytometry plots representative of the parasite cells found in the corresponding regions of viability. (c) Pharmacokinetic modeling of the concentrations of inhibitor 7k during the in vivo testing. Experimental data are represented by open symbols. The red lines indicate the preliminary estimate of minimal parasiticidal concentration (MPC) calculated from the experimental results. (d) PK/PD analysis of parasite killing in vivo induced by inhibitor 7k in comparison with chloroquine as a standard reference antimalarial drug. The data shown in the plot are the day of recrudescence (DoR) versus the total exposure in the blood of 7k of each individual mouse normalized by their respective individual parasite burdens as described.34 Data for Chloroquine are from historical data available at TAD for a set of PfalcHuMice treated p.o. UID, for 4 days, with different dose levels of the drug. In this plot, mapping to similar areas of the plot indicates equipotency for parasite killing in the PfalcHuMouse model.

