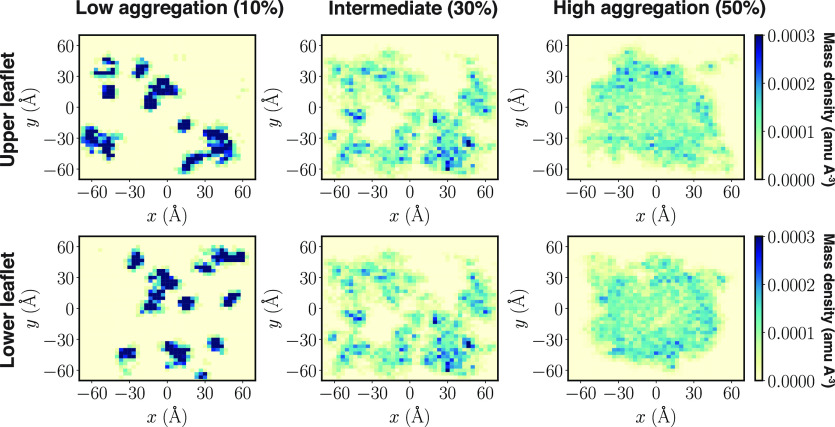
Figure 4.
Aggregation of protonated Lipid-5 on the surface of the bilayer. Mass distribution of the nitrogen atom of protonated Lipid-5 located at the upper and lower leaflet, projected to the x–y plane (membrane plane). The colormap represents the mass density of protonated Lipid-5 with blue and light yellow being the minimum and maximum populations, respectively. The distributions are shown for systems with 10% (left), 30% (middle), and 50% (right) Lipid-5, representing low aggregation, intermediate, and high aggregation states, respectively.

